

We use cookies to ensure our website works properly and to personalise your experience. Cookies policy
1Pallavan Pharmacy College, Kanchipuram-631502
2Department of Pharmaceutics, Pallavan Pharmacy College, Kanchipuram-631502
3Department of Pharmacognosy, Pallavan Pharmacy College, Kanchipuram-631502
4Department of Pharmacology, Pallavan Pharmacy College, Kanchipuram-631502
Polyendocrine metabolic ovarian syndrome (PMOS) is the most common endocrinopathy of reproductive-aged women, with an Indian prevalence estimated between 2.2% and 26%. Insulin resistance (IR) sits at the physiological core of the syndrome, driving compensatory hyperinsulinemia, ovarian and adrenal hyperandrogenism, and a long-term excess risk of type 2 diabetes mellitus (T2DM) and cardiovascular disease. This review consolidates findings from three complementary sources: a Korean case-control study evaluating oral glucose tolerance test (OGTT)-derived IR and β-cell indices in women with PMOS and normal glucose tolerance; a South Indian cross-sectional study correlating HOMA-IR with hirsutism, acanthosis nigricans, and BMI; and a broader narrative review of IR pathophysiology, biomarkers, and management. Across all three sources, IR emerges as a feature of PMOS that is only partly explained by obesity, is closely linked to hyperandrogenism, and is detectable even in lean women and those with normal glucose tolerance. We add context on assessment methods, novel adipokine biomarkers, psychological comorbidity, and current treatment strategies, and present the quantitative findings pictorially for ease of comparison.
Polyendocrine metabolic ovarian syndrome (PMOS) is a heterogeneous endocrine and metabolic disorder affecting women of reproductive age, characterized by oligo/anovulation, clinical or biochemical hyperandrogenism, and polycystic ovarian morphology on ultrasound (Rotterdam criteria: at least two of the three features). Reported prevalence in India ranges from 2.2% to 26% depending on the diagnostic criteria and population studied. Beyond its reproductive manifestations, PMOS carries substantial metabolic risk: insulin resistance (IR) and compensatory hyperinsulinemia are present in an estimated 50–70% of affected women and are recognized as a major driver of the 5- to 10-fold increased risk of type 2 diabetes mellitus compared with healthy women.
A note on terminology: the condition discussed in this review was known as polycystic ovary syndrome (PCOS) for several decades and is referred to by that name in all of the primary studies cited below. Following a multistep global consensus process led by an international coalition of patient and professional organizations, the condition was formally renamed polyendocrine metabolic ovarian syndrome (PMOS) in 2026, to better reflect its endocrine and metabolic features and move away from an emphasis on ovarian cysts, which are not a required or pathological feature of the syndrome. This review uses the current name, PMOS, throughout its own text and figures; where specific historical studies are described, their original terminology (PCOS) is preserved in reference citations, since that is the name under which they were actually published. Historically, IR in PMOS has been viewed largely through the lens of obesity. However, a growing body of evidence—including the OGTT-based data reviewed here—shows that IR can be demonstrated in lean PMOS women and in those with entirely normal glucose tolerance, suggesting that IR is an intrinsic feature of the syndrome rather than simply a consequence of excess adiposity. This review draws together three sources of evidence: a Korean OGTT-based case-control study, a South Indian crosssectional clinical study, and a broader pathophysiology-focused narrative review, to build a single, illustrated account of insulin resistance in PMOS.
2. Pathophysiology of Insulin Resistance in PMOS
Four physiological pillars are classically described in PMOS: (1) disordered gonadotropin-releasing hormone (GnRH) and luteinizing hormone (LH) pulsatility, (2) an intrinsic post-receptor defect in insulin signalling, (3) increased ovarian and adrenal androgen output, and (4) the modulating impact of excess body fat. Affected women appear to have a selective defect in insulin action, mediated by excessive serine phosphorylation of the insulin receptor and insulin receptor substrate-1 (IRS-1), itself driven by increased intracellular serine kinase activity. This post-receptor defect impairs glucosetransport signalling in skeletal muscle and adipose tissue while — paradoxically — leaving the ovarian steroidogenic response to insulin intact or even exaggerated, allowing hyperinsulinemia to keep stimulating theca-cell androgen production.
Hyperinsulinemia compounds hyperandrogenism through at least two mechanisms: it suppresses hepatic synthesis of sex hormone-binding globulin (SHBG), raising free (biologically active) testosterone; and it may directly amplify pituitary LH release and ovarian/adrenal androgen synthesis. The resulting excess androgen impedes normal follicular maturation, producing the follicular arrest and polycystic morphology characteristic of the ovary in PMOS, and contributes to acne, hirsutism, and menstrual irregularity. Figure 1 summarizes this cascade.
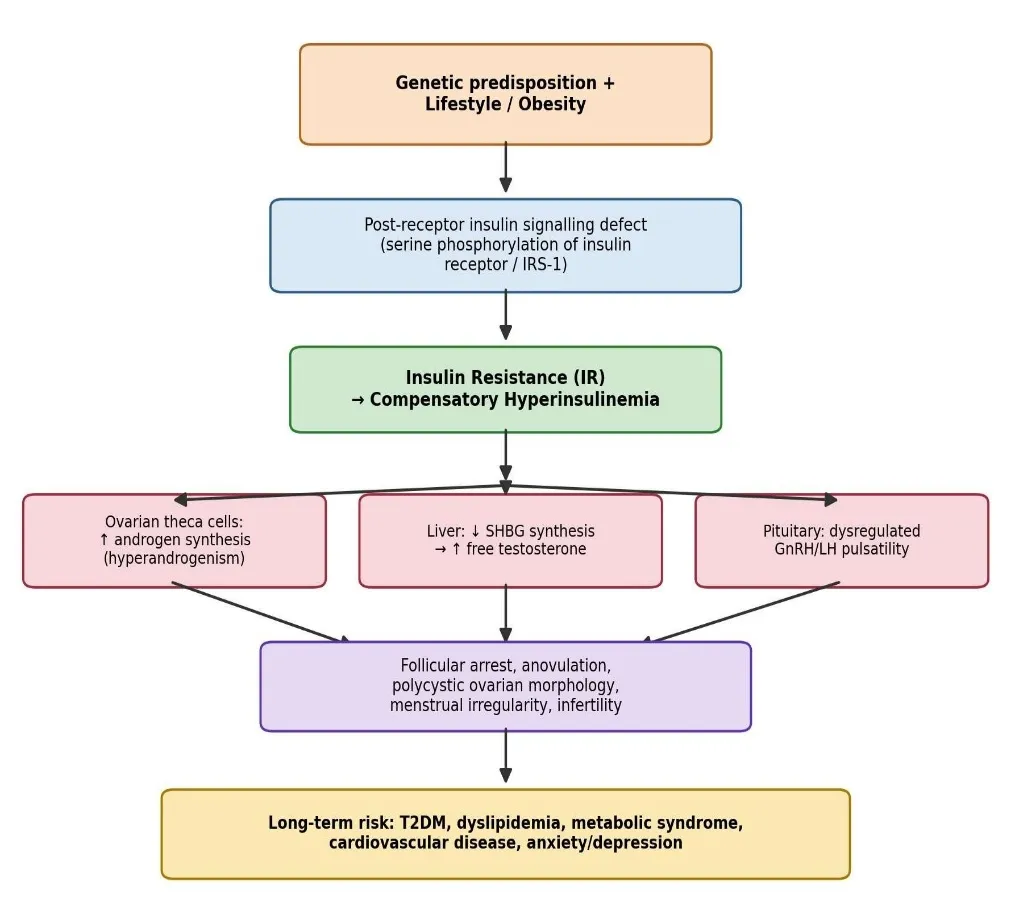
Figure 1. Proposed pathophysiological cascade linking genetic/lifestyle predisposition, insulin receptor signalling defects, hyperinsulinemia, and the reproductive and long-term metabolic consequences of PMOS.
An important nuance, highlighted by the Cureus review, is that obesity is not obligatory for this phenotype: equal proportions of lean and overweight women are diagnosed with PMOS worldwide, and epigenetic mechanisms — potentially triggered by the intrauterine environment or by later lifestyle factors — have been proposed to explain IR that occurs independent of BMI.
Techniques for quantifying insulin resistance range from labor-intensive reference-standard procedures used mainly in research, to simple fasting-based calculations suitable for routine outpatient use, to intermediate OGTT-derived indices that trade some convenience for greater sensitivity. Choosing among them in practice involves balancing accuracy, cost, patient burden, and the population being studied (e.g., lean versus obese PMOS).
3.1. Reference-standard and dynamic techniques
The hyperinsulinemic-euglycemic clamp is regarded as the gold standard for measuring whole-body insulin sensitivity. Insulin is infused at a constant rate to achieve a fixed, supraphysiological plasma concentration, while glucose is infused at a variable rate to maintain euglycemia; the glucose infusion rate required at steady state directly reflects tissue insulin sensitivity. Because it isolates insulin action from the confounding effects of endogenous insulin secretion, the clamp is considered the most accurate available method. However, it requires continuous intravenous access, frequent blood sampling, specialized staff, and 2–4 hours per test, making it impractical outside research settings. A related, less demanding alternative is the frequently sampled intravenous glucose tolerance test (FSIVGTT) with minimal-model analysis, which estimates an insulin sensitivity index from the glucose disappearance curve after an intravenous glucose (± insulin) bolus; it is less burdensome than the clamp but still requires multiple timed venous samples and specialized modelling software.
Because of these practical barriers, most clinical and epidemiological studies — including all three reviewed here — rely on surrogate indices derived from a single fasting sample or from a standard OGTT, validated against clamp-derived measurements in earlier methodological work.
3.2. Fasting-based surrogate indices
3.3 OGTT-derived (dynamic) surrogate indices
Fasting indices capture only the basal insulin–glucose relationship and can under-estimate IR in individuals, including many lean women with PMOS, whose insulin handling is abnormal mainly in the post-prandial state. OGTT-derived indices incorporate one or more post-glucose-load time points and have been reported to detect IR that fasting indices miss:
3.4 Comparing the methods
Table 1. Comparison of methods used to assess insulin resistance and β-cell function, ordered from reference-standard to increasingly practical surrogate indices
|
Method |
Sample(s) required |
Reflects |
Practicality |
|
Euglycemic clamp |
Continuous IV sampling, 2–4 h |
Whole-body insulin sensitivity (gold standard) |
Very low — research only |
|
FSIVGTT (minimal model) |
Multiple timed IV samples |
Insulin sensitivity + β-cell response |
Low — specialized modelling |
|
HOMA-IR /QUICKI /FGIR |
Single fasting sample |
Basal insulin resistance |
High — routine clinical use |
|
HOMA-F |
Single fasting sample |
Basal β-cell secretory function |
High |
|
HOMA-M120 / Stumvoll ISI |
OGTT (1–2 time points) |
Post-prandial insulin resistance; more sensitive in lean PMOS |
Moderate — needs OGTT |
|
Matsuda index |
Full OGTT (4–5 time points) |
Whole-body (hepatic + peripheral) sensitivity |
Moderate — more sampling |
|
Insulinogenic / disposition index |
Early OGTT time points |
Early-phase β-cell responsiveness |
Moderate |
In practice, HOMA-IR remains the default screening tool in most clinical settings, including the South Indian cohort reviewed here, because it requires only a fasting sample. However, the Korean OGTT study demonstrates a clinically important limitation: in lean women with PMOS, fasting-based HOMAIR failed to reach statistical significance versus lean controls, whereas the OGTT-derived HOMA-M120 and Stumvoll index both did. This implies that calculating HOMA-M120 or the Stumvoll index in addition to fasting HOMA-IR may significantly improve detection of IR that would otherwise be missed in situations where an OGTT is already being carried out (for example, for glucose tolerance screening, which is itself advised in PMOS). This is especially true for lean women who might not be identified by weight-based risk assessment alone. The Korean study by Song et al. directly compared these OGTT-derived indices in women with PMOS who had entirely normal glucose tolerance, and is the principal source for the quantitative comparisons in Section 4.
4. Clinical Evidence: Insulin Resistance in PMOS with Normal Glucose Tolerance
4.1. Study design (Song et al., 2017)
This Korean case-control study enrolled 100 women with PMOS and normal glucose tolerance (50 lean, mean BMI 20.4 kg/m²; 50 overweight/obese, mean BMI 25.2 kg/m²) and 100 age- and BMI-matched controls, all of whom underwent a standard 75-g OGTT with glucose and insulin sampling at 30-minute intervals. “Increased β-cell function” was defined as HOMA-F above the 75th percentile of the control group.
4.2. Key findings
Women with PMOS had significantly higher post-load 2-hour glucose, fasting insulin, post-load insulin, HOMA-IR, HOMA-M120, and HOMA-F, and a lower Stumvoll index, compared with matched controls (all p<0.05). Critically, these differences in IR persisted even when lean PMOS women were compared separately with lean controls, and even after matching for β-cell function — indicating that IR in PMOS is not merely a marker of obesity or compensatory hyperinsulinemia. Figure 2 illustrates the magnitude of these differences using the study's reported median values.
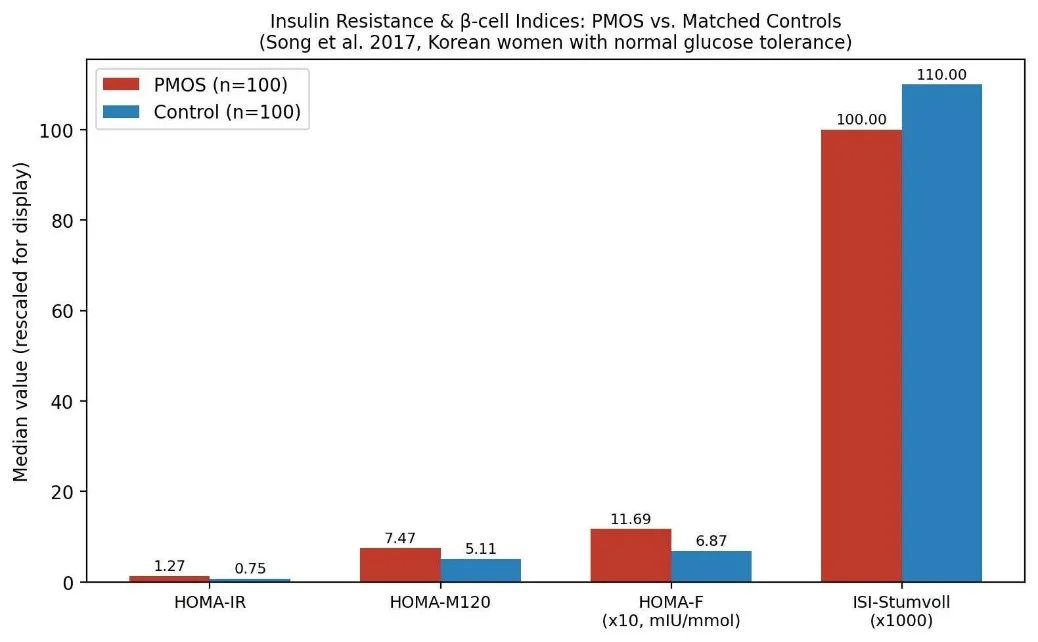
Figure 2. Comparison of OGTT-derived insulin resistance and β-cell indices between women with
PMOS and matched controls, both groups having normal glucose tolerance. HOMA-F values are divided by 10 and Stumvoll index values multiplied by 1000 to allow display on a common axis. Data: Song et al., 2017, Table 1.
On multivariate regression adjusted for age and BMI, HOMA-F was positively associated with HOMAM120 and negatively associated with the Stumvoll index in all PMOS women, and HOMA-M120 correlated positively with triglycerides and free testosterone, while the Stumvoll index correlated negatively with the same variables — findings that were also seen, though more weakly, in the lean PMOS subgroup. The authors concluded that HOMA-M120 (an OGTT/post-load index) detected IR in lean PMOS women more reliably than the traditional fasting-based HOMA-IR, supporting its use as a simple, clinically accessible screening tool even in the absence of obesity.
5. Clinical Evidence: Insulin Resistance and Clinical Phenotype in a South Indian Cohort
5.1. Study design
This cross-sectional study evaluated 50 women newly diagnosed with PMOS (Rotterdam criteria) at a tertiary hospital in rural Andhra Pradesh, India. Fasting glucose and insulin were used to calculate
HOMA-IR (significant IR defined as ≥2.5), alongside clinical grading of hirsutism (modified FerrimanGallwey, FG score) and acanthosis nigricans (Burke 0–4 scale), a cutaneous marker of IR.
5.2. Prevalence and BMI relationship
Overall IR prevalence was 36%, lower than the 50–70% frequently cited in Western literature, which the authors attribute to the milder metabolic phenotype captured by Rotterdam (versus NIH) diagnostic criteria and to the largely rural, physically active study population. Only 8% of participants were obese (BMI ≥30 kg/m²), yet the relationship between BMI and IR was clear and graded, as shown in Figure 3.
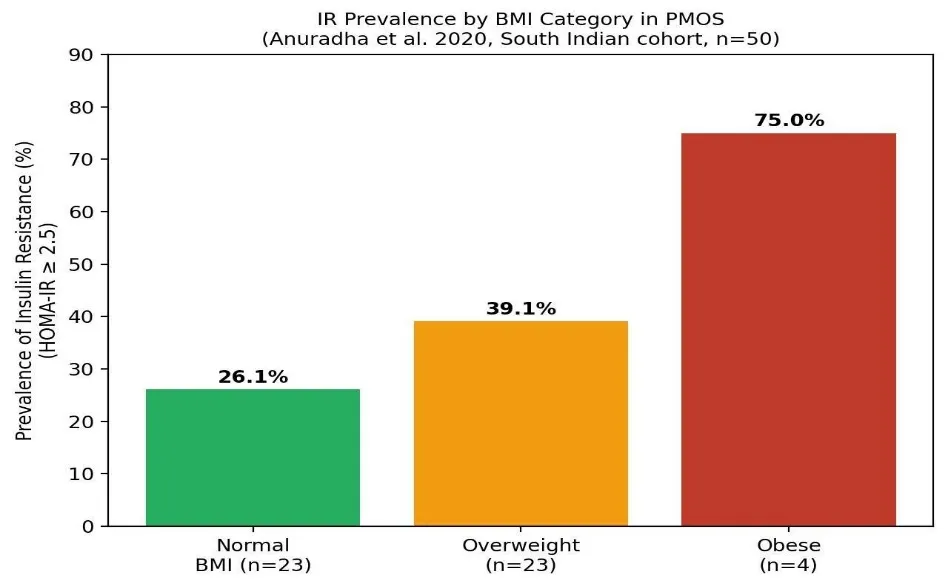
Figure 3. Prevalence of insulin resistance (HOMA-IR ≥2.5) across BMI categories in the South Indian PMOS cohort. IR prevalence rose nearly three-fold from normal-weight to obese participants.
Data: Anuradha et al., 2020, Table 4.
5.3. Relationship with hyperandrogenism and acanthosis nigricans
IR prevalence tracked closely with clinical markers of hyperandrogenism. Women with a FerrimanGallwey score ≥8 (significant hirsutism) had a 75% prevalence of IR, compared with 25.8% in those with mild hirsutism and only 14.3% in women without hirsutism (p=0.001). Acanthosis nigricans showed an even sharper relationship: no participant with grade 0 or grade 1 acanthosis had IR, whereas 77.8% of those with grade 2 and 84.6% of those with grade 3 acanthosis were insulin resistant (p<0.001). All women with impaired fasting glucose (≥110 mg/dL, 18% of the cohort) also had demonstrable IR and were overweight or obese. These relationships are shown in Figure 4.
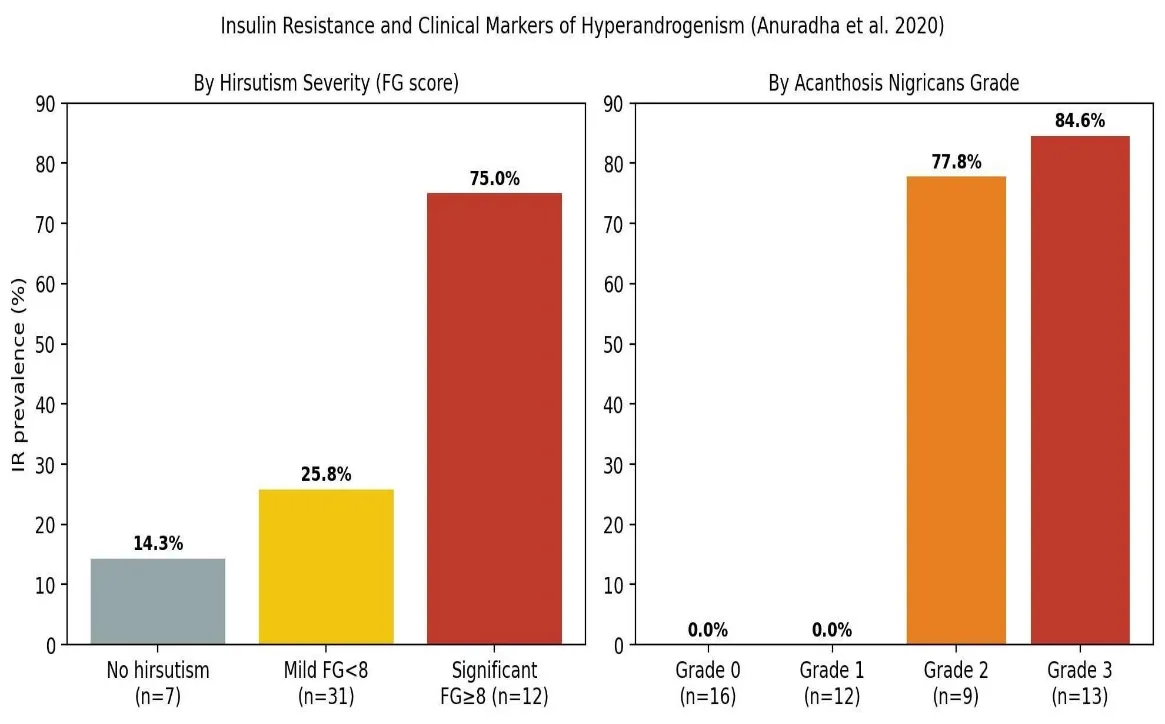
Figure 4. Insulin resistance prevalence stratified by hirsutism severity (left) and acanthosis nigricans grade (right), showing a strong graded relationship between clinical markers of hyperandrogenism/IR and biochemical IR. Data: Anuradha et al., 2020, Table 4.
Taken together, these two clinical studies (Sections 4 and 5) support a consistent picture: IR in PMOS is amplified by, but not dependent on, obesity; it is closely linked to the hyperandrogenic phenotype; and simple bedside markers (acanthosis nigricans, hirsutism grade) together with basic biochemical indices (HOMA-IR, HOMA-M120) can help identify at-risk women without requiring a glucose clamp.
6.Emerging Biomarkers of Insulin Resistance
Beyond the classical HOMA and Stumvoll indices, a range of adipokine and peptide biomarkers have been studied as potential markers of IR in PMOS, as summarized in the Cureus narrative review. Adipose tissue secretes adipokines with divergent effects on insulin sensitivity: adiponectin is insulinsensitizing and is typically reduced in PMOS (associated with obesity, T2DM, and cardiac risk), whereas visfatin has insulin-mimetic, receptor-stimulating activity. Leptin and irisin levels are elevated in obese PMOS women compared with lean women with PMOS, while apelin is increased in PMOS generally. Kisspeptin, a regulator of the reproductive axis, is reduced in PMOS and shows a negative relationship with BMI, androgens, fasting insulin, and HOMA-IR — suggesting it may serve as a marker of both hyperandrogenism and IR severity. Additional emerging markers mentioned include preptin, gremlin-1, neuregulin-4, xenopsin-related peptide, and galectin-3. Figure 5 summarizes this adipokine network.
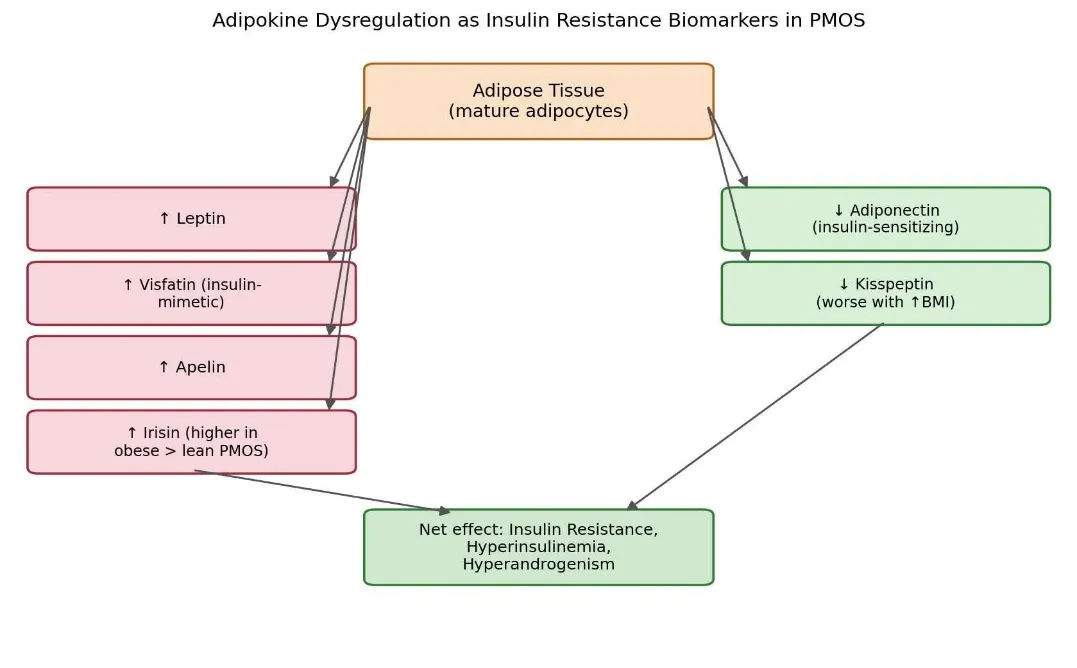
Figure 5. Adipokines secreted by adipose tissue and their reported direction of change in
PMOS/insulin resistance. Increased levels of leptin, visfatin, apelin, and irisin, together with decreased adiponectin and kisspeptin, converge on a net insulin-resistant, hyperandrogenic state. Clinically, none of these novel biomarkers has yet replaced HOMA-IR or OGTT-derived indices in routine practice, but they illustrate that IR in PMOS is embedded in a broader network of adipose-tissue signalling abnormalities rather than being a single, isolated defect.
6.1 Psychological and quality-of-life dimension
IR and hyperandrogenemia in PMOS also correlate with psychological morbidity, largely independent of age and BMI. Anxiety has been reported in up to 40% of women with PMOS, alongside depression, disordered eating, and reduced quality of life. Proposed contributors include the metabolic/inflammatory burden of IR itself, aberrant cortisol dynamics, and the psychosocial impact of hirsutism, acne, weight gain, and infertility. This dimension is often overlooked in purely biochemical assessments of PMOS but is clinically relevant to holistic management.
6.2 β-cell function: a more nuanced picture
The relationship between IR and β-cell compensation in PMOS is not uniform across populations. Song et al. found increased β-cell function (HOMA-F) in Korean women with PMOS overall, but this increase was not statistically significant when lean PMOS women were analyzed alone — suggesting that compensatory hyperinsulinemia may be more a feature of overweight/obese PMOS than of lean PMOS. This contrasts with reports of early impaired β-cell function in some Chinese cohorts, highlighting that ethnicity, age, and diagnostic criteria (Rotterdam vs. NIH) all influence observed metabolic phenotypes — a point echoed by the South Indian study's comparatively low IR prevalence (36%) relative to Western reports of 50–70%.
Across all three sources, lifestyle modification is consistently positioned as first-line management: structured aerobic exercise (including high-intensity interval training), dietary modification (reduced intake of saturated fat, refined sugar, and total calories where excess weight is present), and weight reduction in overweight/obese women. Even modest weight loss has been shown to improve menstrual regularity, insulin sensitivity, and androgen profile. Pharmacological options include insulin-sensitizing drugs, principally metformin, which over at least an 8-week course has been associated with reductions in weight, fasting glucose, and fasting insulin of roughly 14%, a 22% reduction in calculated HOMA-IR, and up to a 40% reduction in new-onset diabetes in at-risk populations; improvement in hirsutism has also been reported with prolonged use. Hormonal contraceptives and anti-androgen medications address the reproductive/dermatological manifestations, while myo-inositol has gained attention as an insulin-sensitizing adjunct, particularly in women pursuing assisted reproduction. Because IR appears to be intrinsic to PMOS rather than purely a consequence of obesity, the South Indian study's authors argue that clinical markers such as acanthosis nigricans and hirsutism severity — rather than universal biochemical IR testing — may be a pragmatic, cost-effective way to triage which women most need metabolic screening and early intervention, particularly in resource-limited settings.
CONCLUSION
Insulin resistance is a central, largely obesity-independent feature of polyendocrine metabolic ovarian syndrome, evident even in lean women and in those with entirely normal glucose tolerance. OGTTderived indices such as HOMA-M120 and the Stumvoll index appear more sensitive than fasting-based HOMA-IR for detecting this IR in lean women, while simple clinical markers — hirsutism severity and acanthosis nigricans grade — correlate strongly with biochemical IR and may aid risk stratification in settings where OGTT is not routinely feasible. Mechanistically, a selective post-receptor defect in insulin signalling, amplified by adipokine dysregulation, links hyperinsulinemia to hyperandrogenism and the reproductive phenotype of PMOS, while also conferring long-term risk of type 2 diabetes, dyslipidemia, cardiovascular disease, and psychological morbidity. Early recognition of IR — even in lean, normoglycemic women with PMOS — together with lifestyle modification and, where indicated, insulin-sensitizing therapy, remains the cornerstone of comprehensive PMOS management.
REFERENCES


I. Kavipriya*, K. Malarvizhi, J. Karthi, S. Swarnalatha, Insulin Resistance in Polyendocrine Metabolic Ovarian Syndrome: Mechanisms, Clinical Evidence, and Emerging Biomarkers, Int. J. Med. Pharm. Sci., 2026, 2 (8), 504-514. https://doi.org/10.5281/zenodo.21921933
 10.5281/zenodo.21921933