

We use cookies to ensure our website works properly and to personalise your experience. Cookies policy
Swami Vivekanand College of Pharmacy, Indore M.P
This study aimed to formulate and optimize a self-emulsifying drug delivery system (SEDDS) for the enhanced solubility and bioavailability of poorly water-soluble drugs, specifically Atorvastatin calcium, classified under Biopharmaceutical Classification System (BCS) as Class II. Initial investigations involved solubility assessments and the construction of ternary phase diagrams to select suitable excipients for the SEDDS. The composition of the Atorvastatin calcium-loaded SEDDS was optimized using a 3^2 factorial design, with a focus on mean globule size and percentage drug load. The influence of formulation parameters was evaluated through analysis of variance and regression models, followed by optimization of various formulation and process variables using response surface methodology. The optimal formulation was achieved through response optimization via desirability function, with experimental results closely aligning with predicted values.The optimized Atorvastatin calcium SEDDS formulation consisted of sunflower oil as the oil phase, labrasol as the surfactant, and transcutol HP as the cosurfactant (Smix), with a ratio of 67.586% oil and 52.529% % w/w Smix. This formulation resulted in SEDDS with reduced droplet size (169.7 nm), low polydispersity index (PDI) of 0.2, and a zeta potential of -31.8 mV, alongside a high drug load of 87.2%. The study found that smaller particle size and a higher drug load in the self-emulsifying drug delivery system (SEDDS) resulted in increased drug release, leading to improved bioavailability. In vitro assessments, such as emulsification time, viscosity, cloud point, turbidity, refractive index, and optical clarity, met the required standards for all formulations. Stability tests showed no significant changes in particle size and drug load over 6 months. Importantly, the optimized Atorvastatin SEDDS released 99.75% of the drug within 90 minutes, outperforming the marketed formulation and API suspension. The release followed first-order kinetics, primarily through Fickian diffusion. In summary, SEDDS holds promise as an effective carrier for enhancing the dissolution and bioavailability of poorly soluble drugs, like Atorvastatin calcium, potentially improving therapeutic outcomes.
The oral route has long been the predominant method of drug administration for both chronic and acute treatments. However, a significant challenge in drug delivery arises from the fact that over 50% of drug compounds possess unfavorable physicochemical properties, with high lipophilicity being a major concern. Approximately 40% of new drug candidates exhibit low water solubility, resulting in poor bioavailability, increased intra and inter-subject variability, and a lack of dose proportionality. Among the various factors limiting the bioavailability of such compounds, one of the most critical is the rate of absorption from the gastrointestinal lumen, a parameter intrinsically related to dissolution [1]. The Biopharmaceutical Classification System (BCS) classifies drugs into four categories, with BCS II and BCS IV being the classes with poor aqueous solubility. BCS II drugs have low solubility but good permeation properties, while BCS IV drugs are characterized by both poor water solubility and poor permeability, making formulation development for them exceptionally challenging. Various strategies have been explored to enhance the bioavailability of poorly soluble drugs, including salt formation, micronization, nanocrystals, and solid solutions. While these approaches have shown promise, they often face obstacles related to manufacturing ease, scale-up, and product stability. Improving the solubility of hydrophobic drugs remains a formidable task in pharmaceutical development. Common techniques such as salt formation, solubilization, and particle size reduction have limitations, especially when dealing with neutral compounds or weakly acidic/weakly basic drugs. Additionally, solubilization in organic solvents or aqueous media can lead to undesirable liquid formulations. Particle size reduction is effective to a point, but there are practical limits to this approach. To overcome these limitations, various formulation methods have been explored, including the use of cyclodextrins, permeation enhancers, nanoparticles, and solid dispersions. These strategies offer potential solutions to the challenges associated with enhancing drug solubility and bioavailability [2-3].
Self-Emulsifying Drug Delivery Systems (SEDDS)
Self-Emulsifying Drug Delivery Systems (SEDDS) represent a promising solution to address formulation challenges associated with drugs characterized by poor aqueous solubility. SEDDS are a type of oral lipid dosage form composed of a blend of oils, surfactants, hydrophilic solvents, and co-solvents/surfactants. When exposed to gastric fluids and subjected to mild agitation facilitated by gastric motility, these formulations disperse readily, forming either an oil-in-water (o/w) emulsion or microemulsion. This unique property allows them to deliver lipophilic drugs in liquid form, in the form of small oil droplets, circumventing the rate-limiting dissolution process typically encountered with poorly soluble drugs. Consequently, SEDDS can enhance bioavailability and promote reproducible drug plasma profiles. Furthermore, the rapid emptying of fine oil droplets from the stomach leads to improved drug distribution throughout the gastrointestinal tract, reducing potential irritation resulting from prolonged contact between the drug and the gut wall [4].
SEDDS can be classified based on their particle size into three categories:
The main objectives of this study are to create a stable liquid SMEDDS formulation with appropriate excipients, develop Atorvastatin calcium SEDDS to enhance solubility and dissolution, select suitable oil, surfactant, and co-surfactant components, assess various parameters such as cloud point, emulsification time, particle size, PDI, zeta potential, viscosity, optical clarity, refractive index, turbidity, and drug loading, conduct in vitro release studies, perform stability tests following ICH guidelines, and ultimately encapsulate the optimized L-SEDDS in soft gelatin capsules [5-6].
MATERIALS AND METHODS
Drug Atorvastatin Calcium was a gift sample provided by Cyano Pharmaceuticals, Indore and other excipients were procured from institute
Preformulation Studies: Preformulation is the initial and essential step in drug dosage form development, focusing on assessing the physical and chemical properties of the drug substance alone and in combination with excipients. It provides the basis for effective product formulation, quality optimization, and the overall success of the formulation process. A thorough understanding of the active ingredient's physicochemical characteristics is imperative before proceeding with formulation work [7-9].
Important parameters evaluated during preformulation studies:
Table 1: Solubility Specifications
|
Descriptive terms |
Approximate volume of solvent in milliliters per gram of solute |
|
Very soluble |
Less than 1 |
|
Freely soluble |
From 1 to 10 |
|
Soluble |
From 10 to 30 |
|
Sparingly soluble |
From 30 to 100 |
|
Slightly soluble |
From 100 to 1000 |
|
Very slightly soluble |
From 1000 to 10,000 |
|
Practically insoluble |
More than 10,000 |
Ө = tan –1(h/r)
Table 2: Angle of Repose as an Indication of Powder Flow Property
|
Flow properties |
Angle of repose (degree) |
|
Excellent |
25-30 |
|
Good |
31-35 |
|
Fair |
36-40 |
|
Passable |
41-45 |
|
Poor |
46-55 |
|
Very poor |
56-65 |
|
Extremely poor |
>66 |
ρbulk = m/Vo
ρt = m/Vt
CI = ρt – ρbulk / ρt × 100
Table 3: Carr’s Compressibility Index
|
S. No. |
Compressibility Index (%) |
Flow Characters |
|
1 |
< 10 |
Excellent |
|
2 |
11-15 |
Good |
|
3 |
16-20 |
Fair |
|
4 |
21-25 |
Passable |
|
5 |
26-31 |
Poor |
|
6 |
32-37 |
Very poor |
|
7 |
>38 |
Extremely poor |
Hausner’s Ratio = ρt / ρbulk
Table 3: Hausner’s Ratio as an Indication of Powder Flow
|
S. No. |
Hausner’s ratio |
Type of flow |
|
1 |
1.0 –1.11 |
Excellent |
|
2 |
1.12 – 1.18 |
Good |
|
3 |
1.19 – 1.25 |
Fair |
|
4 |
1.26 – 1.34 |
Passable |
|
5 |
1.35 – 1.45 |
Poor |
|
6 |
1.46 - 1.59 |
Very poor |
|
7 |
>1.60 |
Extremely poor |
%Retained = WSieveWTotal ×100%
Table 4: Classification of Sample Based on the Percentage
|
S. No. |
Nature of sample |
Result of determination |
|
1 |
Coarse powder |
NLT 95% of the sample mass pass through #14 and NMT 40% pass through #36 |
|
2 |
Moderately coarse powder |
NLT 95% of the sample mass pass through #25 and NMT 40% pass through #60 |
|
3 |
Moderately fine powder |
NLT 95% of the sample mass pass through #36 and NMT 40% pass through #100 |
|
4 |
Fine powder |
NLT 95% of the sample mass pass through #100 and NMT 40% pass through #150 |
|
5 |
Very fine powder |
NLT 95% of the sample mass pass through #150 and NMT 40% pass through #200 |
|
6 |
Super fine powder |
NLT 90% by number of particles are less than 10µm |
Drug-Excipient Compatibility Studies: In tablet form, drugs interact closely with excipients, potentially impacting drug stability. Understanding these interactions helps formulators choose suitable excipients, especially for known drugs [10-11].
Table 5: Drug-Excipient Compatibility Studies
|
S. No |
Drug and excipients |
Parameter |
|
1 |
Atorvastatin Calcium |
Colour change |
|
2 |
Atorvastatin Calcium + Excipients |
Colour change |
B. Thin Layer Chromatography (TLC): TLC is a chromatographic analysis method using an adsorbent-coated plate. Test samples and controls are placed on the plate's baseline and exposed to a mobile phase in a closed chamber. Analytes move through capillary action, and incompatibilities are identified by differences in the Rf value compared to controls. In this study, drug and excipients were mixed and observed for any changes in an oven. The TLC method was used to analyze interactions.
Methanol: Water (2:1)
Identification test for oils [12-13]
Specific gravity: The specific gravity of the oils was tested by specific gravity bottle method and the procedure followed as per Bureau of Indian standards.
Determination of iodine value by WIJS method
Preparation of potassium iodide solution: 10 g of potassium iodide was dissolved in 90 ml of water.
Starch Solution: 5 g of starch and 0.01 g of mercuric iodide were mixed with cold water and added to boiling water. The solution was cooled, and the clear liquid was separated.
Standardization of sodium thiosulphate solution: A 0.1 Normal solution of sodium thiosulphate was prepared. A solution of potassium dichromate was titrated with sodium thiosulphate, using starch as an indicator, to determine the sodium thiosulphate solution's normality.
25W
49.03V
Preparation of WIJS solution: A solution was made by dissolving 13g of iodine in 1 liter of acetic acid. Its strength was determined by titration with standard sodium thiosulphate solution. Chlorine gas was introduced to double the halogen content, confirmed by titration.
Procedure: 0.2 g of the sample was dissolved in 25 ml of carbon tetrachloride and 25 ml of the WIJS solution. After standing for a specified time, potassium iodide solution and water were added, and liberated iodine was titrated with sodium thiosulphate. Starch solution was used as an indicator. Iodine value was calculated accordingly.

Determination of saponification value
Preparation of alcoholic potassium hydroxide Solution: Dissolve 35-40 g of potassium hydroxide in 20 ml of distilled water and add rectified spirit to make up to 1000 ml. Allow to stand overnight, decant the clear liquid, and seal the bottle.
Preparation of 0.5N hydrochloric acid: Dilute 42.5 ml of hydrochloric acid to 1000 ml with distilled water.
Procedure: Weigh 1-2 g of the oil, transfer it to a conical flask, and add 25 ml of alcoholic potassium hydroxide solution. Reflux with an air condenser for up to one hour on a water bath. Boil until saponification is complete, indicated by a clear solution with no oily residue. Cool, add 1 ml of phenolphthalein, and titrate with standard hydrochloric acid. Calculate the saponification value accordingly.
Saponification value =56.1 (B-S) NW

Determination of acid value
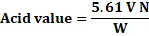
Preparation of 0.1N sodium hydroxide: Dissolve 5.611g of potassium hydroxide in enough water to make 1000 ml.
Procedure: Weigh 1 g of oil and transfer it to a 200 ml conical flask. Add 50 ml of freshly neutralized hot ethyl alcohol and 1 ml of phenolphthalein indicator solution. Boil for five minutes, then titrate with 0.1N sodium hydroxide solution. Calculate the acid value accordingly.
Acid value=5.61 V NW
Development of Standard Calibration Curve of Atorvastatin Calcium in Methanol UV Spectroscopy (λ max): The absorption maximum of the standard solution of Atorvastatin calcium was scanned between 200- 400 nm regions on UV- visible spectrophotometer.
Preparation of standard stock solution: Weigh 50 mg of Atorvastatin calcium, dissolve it in methanol, and sonicate at 60°C for 10 minutes. Dilute to 50 ml with methanol to obtain a concentration of 1000 μg/ml. Take 5 ml of this solution, dilute to 50 ml with methanol to achieve a concentration of 100 μg/ml.
Preparation of calibration curve: Pipette 2, 4, 6, 8, 10, and 12 ml from the stock solution into 100 ml volumetric flasks. Dilute to the mark with methanol to get concentrations of 2-12 μg/ml. Measure the absorbance at 247 nm against methanol as a blank using a UV-visible spectrophotometer.
Preparation of Buffer Solutions
Preparation of 0.2M Potassium dihydrogen phosphate: Dissolve 27.218g of potassium dihydrogen orthophosphate in 1000ml of distilled water.
Preparation of 0.2M sodium hydroxide: Dissolve 8.0g of sodium hydroxide in 1000 ml of distilled water.
Preparation of Phosphate Buffer pH 6.8: Combine 50 ml of 0.2M potassium dihydrogen phosphate and 22.4 ml of 0.2M sodium hydroxide in a 200ml volumetric flask. Dilute with distilled water to achieve the required volume for the pH 6.8 phosphate buffer.
Development of Calibration Curve of Atorvastatin Calcium in Phosphate Buffer pH 6.8
Preparation of standard stock solution: Weigh 10 mg of Atorvastatin calcium and dissolve it in a 100 ml volumetric flask with an adequate amount of pH 6.8 phosphate buffer. Dilute the solution with the same buffer to achieve a concentration of 100 μg/ml.
Calibration Curve Preparation: Aliquots of 2, 4, 6, 8, 10, and 12 ml were taken from the stock solution and placed into separate 100 ml volumetric flasks. The volume was adjusted to the mark with phosphate buffer of pH 6.8, creating concentrations ranging from 2-12 μg/ml. The absorbance of these solutions was measured against a blank containing only phosphate buffer of pH 6.8.
Solubility Studies: Atorvastatin calcium solubility was assessed in various media, including aqueous solutions at different pH levels (pH 4 and 7.4), distilled water, and organic solvents like dimethylsulphoxide and dimethylformamide. Aqueous solutions at pH 4.0 and 7.4 were prepared by adjusting with dilute hydrochloric acid and dilute sodium hydroxide. Each solvent (2 ml) was placed in a 5 ml glass vial, and an excess of the drug (150 mg) was added. Solubility was also examined by mixing an excess of the drug (150 mg) with 2 ml of various oils, surfactants, and co-surfactants in screw-capped glass vials, followed by vortex mixing for 30 seconds using a vortex mixer (Sphinx, Japan). These mixtures were shaken for 48 hours at 30°C in a temperature-controlled shaking water bath, followed by equilibrium for 24 hours. The sample mixtures were then centrifuged at 3000 rpm for 10 minutes, and the supernatant liquid was filtered through a 0.45μ millipore membrane filter. Samples were appropriately diluted with methanol, followed by sonication for 10 minutes, and finally diluted with the same solvent. The final drug concentration was quantified using a UV-visible spectrophotometer at 247 nm for Atorvastatin calcium. The experiment was conducted in triplicate, and the results are presented as mean values (mg/ml) ± SD [14].
Construction of Ternary Phase Diagram: Ternary phase diagrams for each drug, Atorvastatin calcium included, were created using sunflower oil, coconut oil, corn oil, sesame oil, and mustard oil as oils, EG 400 and Tween 80 as surfactants, and methanol and ethanol as co-surfactants. The percentages of oil, surfactant, and co-surfactant were determined based on safety guidelines and the lipid formulation classification system (LFCS) introduced by Pouton. A modified grading method by Craig et al. was adopted to create these diagrams. Various self-emulsifying systems were prepared, each containing 10% w/w of the respective drug. The systems were tested for their tendency to spontaneously emulsify and form fine droplets in water at 37°C. The results were categorized as 'good' for easy emulsion formation and 'bad' for poor or no emulsion formation. The experiment was repeated three times [15].
Preparation of SEDDS: SEDDS formulations were prepared using optimal oil and Smix ratios determined from phase diagrams. The drug was dissolved in Smix mixtures with gentle vortexing and sonication, followed by the addition of oil. Different batches were created with varying oil and Smix amounts. These batches, each containing a single dose of Atorvastatin, were used to study the effects of formulation variables. A 32 factorial design was employed for this purpose. The final formulation was equilibrated in a 37°C water bath for 48 hours before analyzing droplet size, polydispersity index, and dissolution. The optimized formulations followed the same procedure.
Experimental Design: 32 Full Factorial Design: A 32 full factorial design was employed to explore and optimize the effects of various formulation ingredients on the in-vitro performance of liquid SEDDS. This design included main effects, interaction effects, and quadratic effects. Thirteen experimental runs, including four replicates at the center, were generated and assessed using Design-Expert software. The replication aimed to estimate experimental error and enhance precision by calculating a model-independent estimate of the process standard deviation. The significant response factors used to evaluate SEDDS formulation quality were particle/globule size (Y1) and drug loading (Y2). The data obtained for each response was fitted to a quadratic polynomial model represented by a non-linear equation.
Y = β0 + β1X1 + β2X2 + β12X1X2+ β1X12 + β2X22 + E
Evaluation of Prepared SEDDS [14-15]
Self-Emulsification and Drug Precipitation Studies: The efficiency of self-emulsification for oral micro/nanoemulsion is assessed through a dispersibility test using a standard USP dissolution apparatus II. In this test, 1 ml of each formulation is introduced into 500 ml of water at 37 ± 0.5°C, and a standard stainless steel dissolution paddle rotates at 50 rpm to provide gentle agitation. The in vitro performance of the formulations is visually assessed, and a grading system is employed based on the type of emulsion formed.
The evaluation of self-emulsification efficiency is performed using a grading system: Grade I represent the rapid formation of a clear or bluish nanoemulsion within 1 minute, while Grade II exhibits a slightly less clear emulsion forming quickly with a bluish-white appearance. Grade III involves the formation of a fine milky emulsion within 2 minutes, while Grade IV forms a dull grayish-white emulsion taking longer than 2 minutes to emulsify. Grade V indicates poor or minimal emulsification with visible oil globules and phase separation, and Grade VI signifies drug precipitation. Formulations falling into Grades I and II maintain their nanoemulsion state in the gastrointestinal tract, and those in Grade III are recommended for SEDDS, with visual assessment as the primary method for evaluating self-emulsification efficiency and optimization guided by factors like the rate of emulsification, droplet size distribution, and turbidity measurements.
Phase separation study: The self-emulsifying formulation was diluted with distilled water up to 5 times and the temperature was maintained at 25°C. The mixture was then mixed for 2 min, stored for about 2 hr and visually observed for any phase separation
Determination of emulsification time: The emulsification time, which signifies the time taken for a pre-concentrate to form a homogeneous mixture upon dilution, was determined by visually monitoring the disappearance of SEDDS and the emergence of the final emulsion in triplicate. This assessment was conducted using a USP II dissolution apparatus (Electrolab) with 500 ml of water at a paddle speed of 50 rpm, maintained at 37°C. A 1 ml portion of SEDDS was added drop by drop to the medium using a pipette, and the time needed for the SEDDS to disappear was recorded.
Spectroscopic characterization of optical clarity: SEDDS formulations disperse in the aqueous phase, forming emulsions or microemulsions, which can be detected by their final appearance and droplet size. Emulsions appear cloudy, while microemulsions are clear or translucent due to their very small droplet size. Optical clarity was assessed visually, and quantitatively by using a UV-visible spectrophotometer. Cloudier solutions absorb more incident light, resulting in higher absorbance values, while optically clear solutions exhibit lower absorbance. The optical clarity of SEDDS formulations in aqueous dispersions was quantitatively measured using a UV-visible spectrophotometer at 400 nm after diluting them 50 times with double-distilled water.
Turbidity measurement: It assessed the rapidity and reproducibility of dispersion equilibrium, utilizing nephelometric turbidity units (NTU). Turbidity was measured using a turbidimeter (Elico D-10, Model 331) on emulsions stored in screw-capped sample vials. For the test, 0.5 ml of the SEDDS formulation was introduced into 250 ml of distilled water in a 500 ml conical flask, stirred by a magnetic stirrer at room temperature.
Viscosity determination: Viscosity studies in SEDDS are crucial for characterizing the system and ensuring stability. Low viscosity indicates an o/w type system, while high viscosity indicates a w/o type system. The viscosity of a 10 ml SEDDS preconcentrate was measured at 25±0.5°C using a Brookfield viscometer with spindle C 16-1 and a shear rate of 50 rpm.
Cloud point measurement: Cloud point temperatures (Tc) were determined by visual observation. A 0.5 ml preconcentrate was diluted to 50 ml with distilled water in a glass beaker and heated at a rate of about 0.5°C/min. The appearance of the dispersion was closely observed, and the temperature at which it became turbid was noted as Tc. This measurement assesses the stability of the microemulsion at body temperature.
Determination of refractive index: The refractive index, n, of a medium is determined using an Abbe's refractometer. To estimate the clarity of microemulsions, SEDDS formulations were diluted 100 times with water, and their refractive index was compared to distilled water on the refractometer.
Droplet size and polydispersity index (PDI) analysis: The droplet size of micro/nano emulsions is measured using photon correlation spectroscopy with a Zetasizer, which can analyze sizes ranging from 10 to 5000 nm. Polydispersity is determined based on a specific equation.
Polydispersity = D (0.9) – D (0.1) /D (0.5)
Zeta potential measurement: Zeta potential of SEDDS formulations was determined with a Zeta sizer ZS 90 using laser Doppler microelectrophoresis. Electric field-induced particle movement was used to calculate zeta potential based on the Helmholtz–Smoluchowski equation. Samples were diluted, sonicated, and measurements were conducted at 25°C in triplicate, presenting data as mean ± SD. The zeta potential determination equation was utilized

Drug loading efficiency: The drug efficiency was done to investigate the effect of drugs on a self-emulsifying performance of SEDDS. Approximately 10 mg of Atorvastatin calcium was added to 1 ml of boundary formulations of SEDDS and checked for a formation of the clear solution.
Prototype formulation for Atorvastatin calcium: Prototype Atorvastatin calcium formulations were created by altering the ratio of sunflower oil in a 3:1 mixture of labrasol and transcutol HP as specified in the composition table. Oil content ranged from 40% to 80%, with a consistent 3:1 ratio of surfactant to co-surfactant. A single dose equivalent of 10 mg of Atorvastatin calcium was added to each mixture and stirred for 15 minutes. The drug loading capacity of each mixture was determined by adding excess Atorvastatin calcium until a clear solution was obtained. After filtration, the drug content was assessed in triplicate using UV-Visible Spectrophotometry. Drug loading efficiency was calculated using a specific equation.

In vitro dissolution studies for Atorvastatin Calcium: In vitro studies evaluated the dissolution rates of optimized Atorvastatin SEDDS, pure Atorvastatin calcium, and a marketed Atorvastatin calcium tablet. The dissolution tests were conducted using a USP type II dissolution apparatus in phosphate buffer (pH 6.8) at 37 ± 0.5°C and 100 rpm. Samples were collected at various time intervals and analyzed for drug content by UV-visible spectrophotometry at 247 nm. The experiments were performed in triplicate, and the mean values of cumulative drug release were used for plotting the release curves [13].
Kinetic modeling and Mechanism of drug release of optimized formulations: The drug release data of optimized formulations were evaluated for various kinetic models viz. zero order, first order, Higuchi model, Hixson-Crowell model and Korsmeyer-Peppas model. The study was carried out to determine the mode of drug release from the formulation by using DD Solver software.
In vitro diffusion release study for Atorvastatin calcium: In vitro performance of SEDDS was evaluated using the dialysis membrane diffusion technique. A pretreated cellulose dialysis bag with a molecular weight cutoff of 12000 Daltons was used. Optimized self-emulsifying formulation and dialyzing medium were introduced into the bag, and the bag was placed in beakers containing phosphate buffer (pH 6.8) at 37± 0.5°C. Samples were collected at various time points, and the drug content was determined spectrophotometrically at 247 nm. The experiment was conducted over a 12-hour period [14].
Statistical Analysis: Statistical validation of the polynomial equations for Atorvastatin calcium SEDDS was performed using ANOVA provided by the software. Thirteen runs were generated by optimal design, and statistical parameters, including sum of squares, mean of squares, F values, and p values, were assessed. Multiple feasibility and grid searches were conducted to identify optimized SEDDS formulations [15].
Stability Studies: Stability testing is essential to assess how a pharmaceutical product's quality changes over time due to environmental factors like temperature, humidity, and light. ICH guidelines recommend specific storage conditions. In this study, Atorvastatin calcium SEDDS formulations stored in soft gelatin capsules underwent stability testing at cold conditions (4-8°C), room temperature, and elevated temperature (50±2°C) for 1 and 6 months. Key parameters, including self-emulsification, phase separation, emulsification time, globule size, and % drug loading, were analyzed to evaluate stability [15].
RESULTS AND DISCUSSION
The present study was carried out to formulate & evaluate SEDDS for enhancement of dissolution of poorly soluble drug. SEDDS were evaluated for various parameters.
Preformulation studies:The following preformulation studies were performed on Atorvastatin calcium & excipients.
Evaluation of Atorvastatin calcium (API)
Table 6: Physical Characteristics of API
|
S. No |
Tests |
Specification |
Results |
|
1 |
Color |
White or off-white powder |
White or off White powder |
|
2 |
Solubility |
Atorvastatin calcium is very slightly soluble in distilled water, pH 7.4 phosphate buffer, and acetonitrile, slightly soluble in ethanol, and freely soluble in methanol. |
Complies |
|
3 |
Melting point |
159.2-160.7℃ |
160℃ |
|
4 |
Moisture content |
NMT 0.5 w/w% |
0.3%w/w |
Discussion: The color, solubility, melting point and moisture content of the API were evaluated. It was found to be within the range of the monograph.
Angle of Repose of Atorvastatin Calcium
Table 7: Results of Angle of Repose
|
S. No |
Raw material (API) |
Angle of repose (Degree) |
Average |
|
1 |
Atorvastatin calcium |
280.14΄ |
280.56΄± 0.69 |
|
2 |
Atorvastatin calcium |
290.36΄ |
|
|
3 |
Atorvastatin calcium |
280.12΄ |
Discussion: The angle of repose of API was found to be 280.56΄± 0.69. Hence the drug belongs to fair flow and requires glidants to improve the flow property.
Bulk Density and Tapped Density of Atorvastatin calcium
Table 8: Results of Bulk Density and Tapped Density of Atorvastatin calcium
|
S. No |
Raw material (API) |
Bulk density (g/ml) |
Average bulk density (g/ml) |
Tapped density (g/ml) |
Average tapped density (g/ml) |
|
1 |
Atorvastatin calcium |
0.459 |
0.453 ± 0.01 |
0.612 |
0.614± 0.003 |
|
2 |
Atorvastatin calcium |
0.452 |
0.614 |
||
|
3 |
Atorvastatin calcium |
0.448 |
0.618 |
Discussion: The average bulk density and tapped density was found to be 0.453 ± 0.01 and 0.614± 0.003 g/ml respectively.
Powder Compressibility and Hausner’s Ratio
Table 9: Compressibility Index and Hausner’s Ratio
|
Raw material (API) |
Compressibility index (%) |
Hausner’s ratio |
|
Atorvastatin calcium |
26.22 |
1.35 |
Discussion: Based on Compressibility index and Hausner’s ratio, it indicates the Atorvastatin calcium (API) belongs to poor flow property.
Particle Size Distribution
Table 10: Particle Size Distribution of Atorvastatin calcium
|
Sieve no |
Empty weight of sieve |
Quantity retained (gm) |
Mass retained (gm) |
Cumulative mass retained (gm) |
Cumulative % retained |
Percentage passing % |
|
#20 |
367.8 |
368.55 |
0.75 |
0.75 |
4.34 |
95.66 |
|
#30 |
417.65 |
417.85 |
0.2 |
0.95 |
5.5 |
94.5 |
|
#40 |
358.05 |
365.65 |
7.6 |
8.55 |
49.56 |
50.44 |
|
#60 |
343.45 |
343.65 |
0.2 |
8.75 |
50.72 |
49.28 |
|
#80 |
340.75 |
340.9 |
0.15 |
8.9 |
51.59 |
48.41 |
|
#100 |
332.5 |
332.85 |
0.35 |
9.25 |
53.62 |
46.38 |
|
Base |
540.45 |
548.45 |
8 |
17.25 |
100 |
0 |
Discussion: From the particle size analysis, it was concluded that the particles size of the API was found to be moderately coarse powder.
Drug - Excipients Compatibility Studies: It was determined as per procedure given in material and method.
Table 11: Drug - Excipients Compatibility
|
S. No |
Composition |
Initial |
After 15 days |
After 30 days |
Conclusion |
|
1 |
Atorvastatin calcium |
White |
NCC |
NCC |
Complies |
|
2 |
Atorvastatin calcium + Excipients |
Brownish |
NCC |
NCC |
Complies |
NCC- No Characteristic Change.
Discussion: In the drug-excipients compatibility study, no significant changes or interactions were observed between the drug and excipients. The appearance of a brown color was attributed to the oils used. Consequently, it was determined that the chosen excipients were compatible with Atorvastatin calcium.
Thin Layer Chromatography (TLC): The Chemical compatibility was determined using TLC. The study reveals that the drug and the excipients were chemically compatible with each other as there was no significant change in the Rf values. The excipients are compatible with the drug selected for the formulation.
Table 12: Chemical Compatibility of Atorvastatin calcium and Excipients
|
S. No. |
Atorvastatin calcium +Excipients |
Room Temperature 40ºC & 75% RH in days |
Result |
|||||
|
Initial |
15th |
30th |
||||||
|
Rf1 |
Rf2 |
Rf1 |
Rf2 |
Rf1 |
Rf2 |
|||
|
1. |
Atorvastatin calcium |
0.63 |
0.61 |
0.61 |
0.56 |
0.61 |
0.58 |
NC |
|
2. |
*D + Sesame oil |
0.56 |
0.55 |
0.62 |
0.60 |
0.59 |
0.63 |
NC |
|
3. |
D + Coconut oil |
0.62 |
0.61 |
0.50 |
0.36 |
0.53 |
075 |
NC |
|
4. |
D + Sunflower oil |
0.58 |
0.56 |
0.63 |
0.61 |
0.61 |
0.50 |
NC |
|
5. |
D + Corn oil |
0.62 |
0.66 |
0.52 |
0.65 |
0.61 |
0.50 |
NC |
|
6. |
D + Mustard oil |
0.60 |
0.61 |
0.50 |
0.56 |
0.55 |
0.68 |
NC |
|
7. |
D + PEG 400 |
0.61 |
0.56 |
0.55 |
0.59 |
0.56 |
0.60 |
NC |
|
8. |
D + Tween 80 |
0.56 |
0.53 |
0.53 |
0.52 |
0.61 |
0.63 |
NC |
Rf1*= standardvalue& Rf2*= sample value. D*= Atorvastatin calcium, NC* - No Change
Discussion: Pure Atorvastatin calcium shows Rf value of 0.63. These are also prominent in the physical mixtures containing Atorvastatin calcium and other excipients in the final formula. This indicates that there is no interaction between the drug and excipients from both Physical observation and TLC studies.
Identification test for oils
Specific gravity: The specific gravity of the oils were determined as mentioned in Bureau of Indian standards of Indian standard specification given under the methods of sampling and test for oils and fats IS 548- 1.
The results obtained were within specific gravity range are given as follows
|
Name of oil |
Specific gravity |
Specific gravity limits as per standards |
|
Virgin sesame oil |
0.917 |
0.916-0.921(Compliesasper USP 2009) |
|
Sunflower oil |
0.916 |
0.914-0.924(Compliesasper USP2009) |
|
Corn oil |
0.915 |
0.914-0.921(Compliesasper USP2009) |
|
Mustard oil |
0.920 |
0.914-0.923(Compliesto USP 12th1942) |
|
PEG 400 |
0.912 |
0.910-0.920 (Compliesas per BIS IS3448- 1984) |
|
Tween 80 |
0.913 |
0.910-0.915(Compliesasper USP2009) |
|
Virgin coconut oil |
0.918 |
0.915-0.920 (Compliesasper BISIS542 1968) |
Determination of saponification value, Iodine value and acid value for oils: The oils were identified by performing any two assessment tests for oils among saponification value, Iodine value and acid value according to the Bureau of Indian standards for Indian standard specification specified under the methods of sampling test for oils & fats IS 548-1.
Virgin sesame oil: Saponification value –191 (complies within the range of 188-195 as per USP 2009) Iodine value – 110 (complies within the range of 103-116 as per USP 2009)
Virgin coconut oil: Saponification value - 190 (complies within the range of 180-200 as per USP 2009) Acid value -0.6 (Complies as per BIS IS 542 1968)
Sunflower oil: Saponification value – 192 (complies within the range of 180-200 as per USP 2009) Iodine value – 110 (complies within the range of 100-140 as per BIS IS 4277-1975)
Corn oil: Saponification value - 189 (complies within the range of 187-193 as per USP 2009)
Iodine value – 110 (complies within the range of 109-133 as per USP 2009)
Mustard oil: Saponification value - 172 (complies within the range of 169-177 as per BIS IS: 546- 1975) Iodine value – 100 (complies within the range of 98-110 as per BIS IS: 546-1975)
PEG 400: Saponification value – 188 (complies within the range 180-195 as per BIS IS 3448 1984) Iodine value – 102 (complies within the range 90-105 as per BIS IS 3448 1984)
Tween 80: Saponification value– 194 (complies within the range of 190-195 as per USP 2009) Iodine value – 84 (complies within the range of 79-88 as per USP 2009)
UV spectroscopic method analysis of Atorvastatin calcium
The calibration curve for Atorvastatin calcium in methanol demonstrated linearity within the concentration range of 2-12 μg/ml. The linear regression equation was y=0.045x+0.003, with a high correlation coefficient (r²) of 0.999, indicating that the drug concentration analysis followed a linear relationship.
Table13: Calibration Data for Atorvastatin Calcium in Methanol
|
S. No. |
Concentration(µg/ml) |
Absorbance |
|
1. |
2 |
0.0913 |
|
2. |
4 |
0.1908 |
|
3. |
6 |
0.2836 |
|
4. |
8 |
0.3774 |
|
5. |
10 |
0.4625 |
|
6. |
12 |
0.5465 |
Figure 1: Calibration curve of Atorvastatin calcium in methanol
Linearity and range for calibration curve of Atorvastatin calcium in phosphate buffer pH 6.8: The calibration curve for Atorvastatin calcium in phosphate buffer pH 6.8 displayed linearity within the concentration range of 2-12 μg/ml. The linear regression equation was y=0.012x+0.001, with a high correlation coefficient of 0.999. This suggests that the drug concentration analysis followed a linear relationship.
Table 14: Calibration data for atorvastatin calcium in phosphate buffer pH 6.8
|
S. No. |
Concentration(µg/ml) |
Absorbance |
|
1. |
2 |
0.0265 |
|
2. |
4 |
0.0529 |
|
3. |
6 |
0.0795 |
|
4. |
8 |
0.1046 |
|
5. |
10 |
0.1279 |
|
6. |
12 |
0.1535 |
Figure 2: Calibration curve of Atorvastatin calcium in phosphate buffer pH 6.8
Solubility Study
Solubility of Atorvastatin calcium in various excipients: Atorvastatin calcium demonstrated low solubility in aqueous acidic solutions (pH 4.0) and slight solubility in water, pH 7.4 phosphate buffer, acetonitrile, and ethanol. It exhibited good solubility in methanol, dimethylsulphoxide, and dimethylformamide. As a class II drug in the BCS classification, it is an ideal candidate for formulation into SEDDS.
The choice of components for lipid-based formulations relies heavily on the drug's solubility in oil, surfactant, and cosurfactant. Sunflower oil, with a solubility of 30.13 mg/ml, proved to be the best choice for dissolving Atorvastatin calcium. Labrasol, a hydrophilic surfactant containing caprylic and capric fatty acid esters, exhibited the highest solubility at 89.23 mg/ml. Transcutol HP, with a solubilization capacity of 38.62 mg/ml, was selected as the cosurfactant. The drug content of Atorvastatin calcium was determined using the Beer-Lambert equation (y = 0.045 × concentration + 0.003).
Table 15: Solubility of Atorvastatin calcium in various excipients
|
S. No. |
Excipients |
Atorvastatincalcium Solubility(mg/ml) |
|
Oils |
||
|
1. |
Virginsesameoil |
15.36±0.006 |
|
2. |
Virgincoconutoil |
25.37±0.015 |
|
3. |
Sunfloweroil |
30.13±0.02 |
|
4. |
Cornoil |
4.86±0.030 |
|
5. |
Mustardoil |
10.35±0.01 |
|
Surfactants |
||
|
6. |
PEG 400 |
89.23±0.015 |
|
7. |
Tween 80 |
1.78±0.011 |
|
Co-surfactant |
||
|
8. |
Methanol |
38.62±0.28 |
|
9. |
Ethanol |
0.666±0.002 |
|
Solvents |
||
|
10. |
Distilledwater |
0.0096±0.012 |
|
11. |
pHPhosphatebuffer7.4 |
0.0095±0.013 |
|
12. |
Acetonitrile |
0.0092±0.003 |
|
13. |
Ethanol |
0.0089±0.014 |
|
14. |
Dimethylsulphoxide |
0.0793±0.022 |
|
20. |
Dimethylformamide |
0.0757±0.003 |
|
21. |
Dichloromethane |
- |
|
22. |
AqueoussolutionofpH 4 |
0.02±0.005 |
Figure 3: Solubility profile of Atorvastatin calcium
IR Spectroscopy of Atorvastatin calcium
Figure 4: IR Spectroscopy of Atorvastatin calcium
Construction of Ternary Phase Diagram: Ternary phase diagrams were created to identify regions where nanoemulsions form. The dark shaded area in the diagram signifies the efficient self-emulsifying region, characterized by clear solutions, no phase separation, and rapid emulsion formation. For Atorvastatin calcium, the chosen ranges for oil, surfactant, and co-surfactant were oil (40–80%), surfactant (22.5–52.5%), and co-surfactant (7.5–17.5%). During emulsification, surfactant molecules migrate to the oil-water interface, reducing interfacial tension. The addition of cosurfactant further decreases interfacial tension, leading to the formation of an ideal curved interfacial film. This results in smaller droplet sizes and a negative value for the free energy of microemulsion formation, signifying spontaneous microemulsion formation. Given the abundant presence of water and a low oil volume fraction, it's safe to assume that only oil-in-water (o/w) emulsions were formed, with no other dispersed or bicontinuous pseudo-phases.
Figure5: Ternary phase diagram of Atorvastatin calcium SEDDS
Variables selected for development of Atorvastatin calcium SEDDS: For Atorvastatin calcium, the component ranges were chosen based on the feasibility of microemulsion formation: oil (40-80%) and Smix (30-70%). The water content was considered a slack variable, given its presence in larger amounts in the gastrointestinal tract. Significant response factors assessed for SEDDS quality were particle size (Y1) and % drug loading (Y2). Optimization was performed using a 3-level, 2-factorial design.Based on preliminary solubility and ternary phase diagram studies, the two independent variables selected for Atorvastatin calcium SEDDS development were the amount of sunflower oil (X1) as the lipophile and the amount of the surfactant mixture (X2) composed of PEG 400 and Tween 80. Three levels for each factor (sunflower oil: 40, 60, 80; PEG 400 and Tween 80: 30, 50, 70) were utilized in the experimental design.
Table16: Variables for Atorvastatin calcium in 32full factorial Design
|
Independent Variables(a) |
Levels |
||
|
Low (-1) |
Middle (0) |
High (-1) |
|
|
X1: Amount of oil added (mg) |
40 |
60 |
80 |
|
X2: Amount of Smixinratioof3:1 added(mg) |
30(22.5:7.5) |
50(37.5:12.5) |
70(52.5:17.5) |
|
Dependent Variables |
Constraints |
||
|
Range |
|
Goal |
|
|
Y1: Particlesize (Globule Size in nm) |
Intherange |
|
Minimize |
|
Y2:% drug loading |
Intherange |
|
Maximize |
(a) Oil: Sunflower oil; Surfactant: Labrasol; Cosurfactant: Transcutol HP
Statistical analysis of the Designed Experiment: A 32 full factorial design was utilized to optimize SEDDS, with oil (X1) and Smix (X2) as independent variables. Thirteen experiments were conducted to generate observed responses. The data were fitted to a second-order quadratic model, and model validation was performed through ANOVA, lack of fit testing, and the determination of correlation coefficients (R2). ANOVA results indicated a significant effect of factors on responses at a 5% significance level. For Atorvastatin calcium, quadratic fitting was significant (p-value < 0.05) for responses Y1 and Y2. Lack of fit was significant for the Y1 response, while it was not significant for the Y2 response. High confidence levels, more than 83.22% for Y1 and 93% for Y2, were observed when predicting values using the regression equations instead of the mean. The coefficients and their interactions and quadratic effects, as well as their relationship with the responses, were determined. Adequate precision values above 4 for all responses indicated that the predicted models are suitable for design space navigation in the full factorial design, the results suggest the significant impact of factors on the responses, and the predicted models are in good agreement with the observed data, supporting their use in the optimization process.
Table 17: Execution of 32 Experimental Design and coding of actual values of independent variables for factorial design with the observed responses
|
Std |
Run |
Formulation Code (FC) |
Oil (mg) |
Smix (mg) |
Y1(Particle size)(nm) |
Y2(%Drug Loading) |
|
7 |
1 |
AF1 |
-1(40) |
+1 (70) |
106.8±4.08 |
81.8±6.63 |
|
4 |
2 |
AF2 |
-1(40) |
0(50) |
172±7.5 |
83.1±4.54 |
|
6 |
3 |
AF3 |
+1(80) |
0(50) |
290±4.9 |
91.5±2.78 |
|
10* |
4 |
AF4* |
0(60) |
0(50) |
112.4±8.5 |
85.1±2.71 |
|
13* |
5 |
AF5* |
0(60) |
0(50) |
128.5±5.68 |
84.3±3.05 |
|
9 |
6 |
AF6 |
+1(80) |
+1 (70) |
285±8.6 |
87.6±1.65 |
|
5 |
7 |
AF7 |
0(60) |
0(50) |
137.9±5.5 |
88.7±1.1 |
|
2 |
8 |
AF8 |
0(60) |
-1(30) |
197.6±5.65 |
75.1±2.75 |
|
8 |
9 |
AF9 |
0(60) |
+1 (70) |
233.1±3.44 |
86.1±4.37 |
|
3 |
10 |
AF10 |
+1 (80) |
-1(30) |
229.7±4.98 |
89.1±4.53 |
|
11* |
11 |
AF11* |
0(60) |
0(50) |
140.2±3.0 |
85.7±4.70 |
|
1 |
12 |
AF12 |
-1(40) |
-1(30) |
415±8.7 |
70.1±2.25 |
|
12* |
13 |
AF13* |
0(60) |
0(50) |
114.9±7.1 |
86.9±1.21 |
Y1: Particle size; Y2: Drug Load; *Centre point Formulations
|
Factors |
Factor Level used |
|||
|
Lowl evel |
Mid Value |
High Value |
||
|
Coded value |
X1&X2 |
-1 |
0 |
+1 |
|
Actual value |
X1 |
40 |
60 |
80 |
|
Actual value |
X2 |
30 |
50 |
70 |
X1 is the % amount of sunflower oil in mg
X2 is the % amount of Smix (PEG 400 and Tween 80) in mg
Analysis of Variation and Regression: Analysis of variance (ANOVA) is commonly used to examine observations from designed experiments. It involves comparing the variance attributed to independent variables or their interactions with the variance associated with random experimental error. If the variance between variables differs significantly from the error variance, the tested treatment is deemed to have a significant effect on the response. The comparison of variances is typically performed using an F-test or F distribution. In this study, ANOVA was utilized to evaluate the proposed models and determine significant factors.In statistical analysis, the mathematical models for each response were assessed through multiple linear regression analysis. Regression analysis helps establish the relationship between response variables (Y) and independent variables (X). The modeling started with a quadratic model, which includes linear, squared, and interaction terms. A linear polynomial regression model approximates the relationship between the response variable and independent variables. The linear first-order polynomial is expressed as Y = β0 + β1X + ε, where Y represents the response, X1 and X2 are the independent variables, and ε is the random error term with a standard deviation of zero. β0 and β1 are the regression coefficients estimating the linear or main effects of the independent variables. Two-level factorial designs are suitable for linear first-order models. To estimate interaction and quadratic effects, a second-order polynomial model with three levels for each variable was chosen in the experimental design. The least squares method was employed to fit a mathematical model to the data.
Self-emulsification, drug precipitation and phase separation studies: In the self-emulsification study, the visual observations of all SEDDS formulations were recorded and evaluated based on visibility grades, as described in the materials and methods section. The results of the graded formulations are presented in the table. Among the formulations tested, AF4, AF5, AF11, AF13, and OPFA (optimized formulations) for Atorvastatin calcium exhibited good stability without any indications of drug/excipient precipitation or phase separation.
Table 18: Self -emulsification and drug precipitation of Atorvastatin calcium SEDDS
|
Formulation Code |
Visibility grade |
Phase separation |
Precipitation |
|
AF1 |
IV |
+ |
++ |
|
AF2 |
III |
+ |
++ |
|
AF3 |
IV |
+ |
++ |
|
AF4* |
I |
X |
XX |
|
AF5* |
II |
X |
XX |
|
AF6 |
III |
+ |
++ |
|
AF7 |
IV |
X |
++ |
|
AF8 |
V |
+ |
++ |
|
AF9 |
III |
+ |
++ |
|
AF10 |
IV |
+ |
++ |
|
AF11* |
I |
X |
XX |
|
AF12 |
III |
+ |
++ |
|
AF13* |
II |
X |
XX |
|
OPFA |
I |
X |
XX |
X = No phase separation, XX = No precipitation, + = phase separation and ++ = precipitation
Assessment of Emulsification time Studies: The ease of emulsification was suggested to be related to the ease of water penetration into the colloidal or gel phases formed on the surface of the droplet. The emulsification time studies indicated the spontaneous emulsification for all formulations.
Table 19: Refractive index, Turbidity, Optical clarity, Polydispersity index, Viscosity, Cloud point measurement and Emulsification time of SEDDS formulations
|
FC |
Refractive Index
|
Turbidity (NTU) |
Absorbance |
Polydispersity index |
Viscosity(cps) |
Cloud point measurement (℃) |
Emulsification time(sec) |
|
AF1 |
1.3343±0.0006 |
132 |
0.402 |
0.171±0.01 |
253±2.65 |
78±3.46 |
132 |
|
AF2 |
1.3352±0.0003 |
146 |
0.487 |
0.244±0.005 |
262±2.66 |
73±3.61 |
119 |
|
AF3 |
1.3366±0.0005 |
210 |
0.529 |
1.097±0.2 |
264±1.73 |
75±5.57 |
121 |
|
AF4* |
1.3331±0.0002 |
90 |
0.455 |
0.381±0.03 |
280±2.31 |
77±3.46 |
138 |
|
AF5* |
1.3334±0.0002 |
94 |
0.432 |
0.377±0.06 |
291±3.51 |
74±3.46 |
126 |
|
AF6 |
1.3345±0.0003 |
168 |
0.517 |
0.148±0.012 |
272±4.58 |
78±5.20 |
112 |
|
AF7 |
1.3363±0.0006 |
320 |
0.456 |
0.379±0.06 |
269±2.89 |
75±3.61 |
95 |
|
AF8 |
1.3358±0.0004 |
357 |
0.493 |
0.292±0.03 |
254±2.66 |
75±4.36 |
82 |
|
AF9 |
1.3349±0.0004 |
92 |
0.501 |
0.128±0.04 |
249±2.08 |
79±4.58 |
75 |
|
AF10 |
1.3347±0.0006 |
96 |
0.497 |
0.386±0.04 |
263±0.56 |
77±5.20 |
62 |
|
AF11* |
1.3330±0.0003 |
91 |
0.466 |
0.343±0.065 |
259±1.53 |
75±3.61 |
64 |
|
AF12 |
1.3352±0.0002 |
93 |
0.629 |
0.224±0.005 |
266±4.04 |
76±2.65 |
67 |
|
AF13* |
1.3333±0.0002 |
95 |
0.452 |
0.333±0.005 |
260±3.56 |
75±1.73 |
69 |
|
OPFA |
1.3330±0.0002 |
92 |
0.425 |
0.2±0.013 |
258±2.23 |
72±1.28 |
61 |
±SD(n=3)
Spectroscopic Characterization of Optical Clarity: As indicated in the table, the absorbance values of the tested aqueous dispersions of Atorvastatin calcium SEDDS ranged from 0.402 to 0.529. These values suggest that the dispersions are optically clear, and the oil droplets are finely dispersed in the system.
Turbidity Measurement: The turbidity of SEDDS was performed determined as per procedure and turbidity for all optimized formulations were found to below 100NTU which shows the stability of SEDDS.
Viscosity Determination: From viscosity determination, it was observed that as the concentration of oil increased, viscosity of formulations decreased as shown in Table. Overall, the viscosity of the undiluted liquid SNEDDS was found less than 10,000 cps which imply that the developed SEDDS can be filled in soft gelatin capsules.
Cloud Point Measurement: For all the formulations the cloud point was found to be below 80℃and the results were shown in Table. From the above result, it can be concluded that a stable micro emulsion of SEDDS can be formed at physiological temperature.
Determination of Refractive Index (RI): The refractive index (RI) of the prepared formulations was determined using an Abbe refractometer. The results show that the formulations exhibit an isotropic nature with RI values ranging from 1.3330±0.0002 to 1.3366 ± 0.0005 for Atorvastatin calcium. Most of the formulations have RI values similar to that of distilled water (1.3330±0.0002) at 28 ± 0.5°C, indicating their clarity resembling water. The RI values tend to increase with higher oil concentration and lower aqueous content. Among the formulations, AF3, with 80% oil concentration, exhibited the highest RI value of 1.3366 ± 0.0005 for Atorvastatin calcium.
Droplet Size, Zeta Potential and Polydispersity Index (PDI) Analysis: The PDI (Polydispersity Index) for all the formulations was less than 0.5, with the lowest PDI value of 0.097 observed in AF3. Formulations containing Smix exhibited lower PDI values, indicating a uniform size distribution. The addition of the drug did not significantly affect the PDI values, suggesting no interference with the emulsification process. The optimized Atorvastatin calcium SEDDS (OPFA) had a mean globule size of 169.7 nm with a PDI of 0.2 and a zeta potential of -31.8 mV. The high zeta potential (above +30 or −30 mV) of the optimized SEDDS indicates the stability of the microemulsion.
(a)
(b)
Figure6: (a) Particle size and, (b)Zeta potential of optimized formulation OPFA for Atorvastatin calcium
Drug Loading: For Atorvastatin SEDDS formulations, drug loading studies were conducted using a UV-visible spectrophotometer (Shimadzu UV-1700). A linear calibration curve for Atorvastatin calcium in the range of 2-20 µg/ml at 247 nm was obtained, with a high correlation coefficient (r2) of 0.999. The drug content of Atorvastatin calcium was calculated using the Beer-Lambert's law equation Y = 0.045 x concentration + 0.003 (r2 = 0.999; p < 0.001). The % drug loading for the optimized formulation of Atorvastatin calcium (OPFA) was found to be 87.2% ± 2.25. It was observed that an increase in Smix concentration enhanced the maximum drug load in SEDDS.
In Vitro Dissolution Studies: The in vitro drug release studies for Atorvastatin calcium SEDDS, including the optimized formulations OPFA, AF4, AF5, AF11, and AF13, were conducted using a USP II dissolution apparatus in phosphate buffer pH 6.8. The results showed significantly higher drug release rates compared to the API and the marketed tablet (Storvas 10 mg for Atorvastatin calcium). This faster drug release was attributed to spontaneous micro-emulsification, which led to quicker drug release into the aqueous phase in the form of small and uniformly dispersed droplets. The drug content was calculated using the Beer-Lambert's law equation Y = 0.012 x concentration + 0.001 (r2 = 0.999; p < 0.001) for Atorvastatin calcium.
Table 20: Cumulative percent release of Atorvastatin calcium from various formulations
|
Time (Min) |
AF1* |
AF5* |
AF11* |
AF13* |
OPFA SEDDS |
API |
Marketed Tablet |
|
0 |
0 |
0 |
0 |
0 |
0 |
0 |
0 |
|
5 |
29.56±0.69 |
28.89±0.88 |
27.45±0.59 |
25.56±1.25 |
26.21±0.74 |
38.69±1.24 |
33.21±2.03 |
|
10 |
34.58±2.08 |
38.56±0.63 |
33.46±1.28 |
32.45±0.19 |
39.3±0.23 |
47.56±0.75 |
45.23±1.12 |
|
20 |
52.56±1 |
55.33±2.02 |
56.59±0.56 |
57.53±0.73 |
58.36±0.45 |
65.22±1.12 |
60.33±2.21 |
|
30 |
74.23±1.59 |
73.52±1.94 |
75.56±1.50 |
74.87±0.22 |
72.66±0.32 |
80.45±1.23 |
79.54±1.64 |
|
40 |
76.89±1.38 |
76.26±0.55 |
77.62±1.20 |
78.66±0.16 |
79.5±0.18 |
86.23±1.56 |
85.62±0.54 |
|
50 |
84.98±1.27 |
82.56±1.16 |
83.32±1.30 |
84.98±0.02 |
86.72±0.16 |
89.21±2.73 |
86.74±2.21 |
|
60 |
91.26±2.74 |
90.21±1.48 |
90.36±0.17 |
91.63±0.44 |
91.3±0.55 |
92.34±1.23 |
90.69±1.72 |
|
75 |
92.27±1.78 |
92.24±2.55 |
92.48±0.56 |
93.56±1.22 |
94.5±0.49 |
93.86±0.62 |
92.66±1.54 |
|
90 |
95.85±1.30 |
96.16±0.72 |
97.28±1.13 |
98.56±0.44 |
99.75±0.31 |
95.64±1.26 |
93.31±1.18 |
Figure 7: Dissolution comparison graph of API, marketed and optimized formulation of Atorvastatin calcium SEDDS
In Vitro Diffusion Release Study: Diffusion study was carried out to study the release behavior of formulation from liquid crystalline phase around the droplet using dialysis technique. In vitro diffusion profile of Atorvastatin calcium from optimized SEDDS in phosphate buffer (pH 6.8) is given in Table. It was observed that at the end of 12-hour, formulation OPFA SEDDS showed about 99.24% diffusion due to its nano range globule size and presence of surfactant/co-surfactant. In contrast, the marketed tablet (Storvas 10mg) showed about 98.18 % diffusion of the drug in 12 hours due to low aqueous solubility.
Table 22: Percent cumulative drug absorbed through dialysis membrane of optimized Atorvastatin calcium SEDDS formulations
|
Time In hours |
AF4* |
AF5* |
AF11* |
AF13* |
OPFA SEDDS |
Marketed Tablet |
|
0 |
0 |
0 |
0 |
0 |
0 |
0 |
|
0.5 |
82.19±1.23 |
84.93±1.54 |
83.45±0.76 |
82.31±0.78 |
89.32±2.17 |
81.25±2.25 |
|
1 |
92.19±0.78 |
93.42±2.78 |
92.64±1.23 |
91.89±0.98 |
92.22±0.91 |
90 ±1.14 |
|
2 |
93.75±1.84 |
94.23±1.66 |
93.62±2.46 |
93.16±1.19 |
93.43±1.56 |
92±1.98 |
|
4 |
94.94±2.21 |
94.45±2.56 |
94.89±0.78 |
94.23±2.56 |
95.36±2.45 |
94 ±2.54 |
|
6 |
96.28±0.73 |
96.82±0.84 |
96.4±0.92 |
96.45±0.74 |
96.39±1.47 |
95 ±2.69 |
|
8 |
97.67±0.94 |
97.14±2.41 |
97.54±1.47 |
97.67±1.64 |
98.56±0.95 |
96.9±1.85 |
|
12 |
98.45±1.86 |
98.25±1.78 |
98.23±2.82 |
98.21±2.47 |
99.24±2.26 |
98.18±0.99 |
Stability Studies: The optimized SEDDS of Atorvastatin calcium, loaded in size 3 soft gelatin capsules, underwent stability studies at cold conditions (4-8°C), room temperature (25°C), and elevated temperature (50°C) with ambient humidity. The results showed no significant changes in % drug loading and particle size, indicating stability under these conditions. Additionally, the formulation was found to be compatible with soft gelatin capsule shells, with no deformation observed. There were no signs of phase separation or drug precipitation, confirming the stability and compatibility of the developed formulation with soft gelatin capsules.
Table 23: Stability studies of optimized Atorvastatin calcium SEDDS formulations
|
Temperature (℃) |
Particle Size(nm) |
%drug load |
||
|
Initial |
After1 month |
Initial |
After1 month |
|
|
Cold Temperature (2-8℃) |
173±2.23 |
176±1.23 |
87.2±1.33 |
83.7±1.89 |
|
Room Temperature (25±2℃) |
169.7±1.85 |
171.7±0.86 |
88.9±2.24 |
86.2±2.65 |
|
Elevated Temperature (50±2℃) |
170±2.35 |
175.6±1.56 |
85.9±1.42 |
81.9±2.78 |
CONCLUSION:
This study successfully developed an oral self-emulsifying drug delivery system (SEDDS) for poorly water-soluble Atorvastatin calcium, categorized as a BCS Class II drug. The formulation was optimized using factorial design and response surface methodology, resulting in SEDDS with smaller particle size, increased drug load, and improved stability. The in vitro release studies demonstrated significantly enhanced drug release and better bioavailability compared to traditional formulations. These findings suggest that SEDDS holds promise as a potential drug carrier to enhance the dissolution of Atorvastatin and similar poorly soluble drugs.
REFERENCES

Ravina Patidar*, Sunita Patidar, Rajat Pawar, Manju Chouhan, P. K. Dubey, Formulation & Development Of O/W Self-Emulsifying Drug Delivery System for Enhancement of Dissolution of Poorly Soluble BCS Class II Drug, Int. J. Med. Pharm. Sci., 2026, 2 (7), 640-662. https://doi.org/10.5281/zenodo.21350421
 10.5281/zenodo.21350421