

We use cookies to ensure our website works properly and to personalise your experience. Cookies policy
1Principal, Vidya Niketan College of Pharmacy, Lakhewadi, Pune, Maharashtra, India 413103.
2Associate Professor, Vidya Niketan College of Pharmacy, Lakhewadi, Pune, Maharashtra, India 413103.
3Vidya Niketan College of Pharmacy, Lakhewadi, Pune, Maharashtra, India 413103
A simple, precise, accurate RP-HPLC method with DAD detector has been developed and subsequently validated for the simultaneous estimation of Levosalbutamol Hydrochloride and Budesonidein pure and pharmaceutical dosage form. The estimation was carried out on Zorbax Bonus-RP (4.6x 250mm 5um), at 1 ml/min flow rate, detection wavelength is 239 nm, mobile phase containing 0.1% Perchloric Acid: Acetonitrile in ratio of 35:65.The retention times of Levosalbutamol Hydrochloride and Budesonidewere 2.34 min & 5.78 min respectively. The concentration range was found to be linear 10 to 15µg/ml for Levosalbutamol Hydrochloride and 04-6 µg/ml for Budesonide. The correlation coefficient (r2) was found to be 0.999 for both the drugs. LOD and LOQ value for Levosalbutamol Hydrochloridewas found to be 0.39μg/mL and 1.18 μg/mL, LOD and LOQ value for Budesonide was found to be 0.09 μg/mL and 0.27μg/mL respectively.The %RSD values were less than 2 for both the drugs. Assay forLevosalbutamol Hydrochloride and Budesonide was found to be 100.01 &100% respectively. The method was validated for linearity, accuracy, precision, robustness, LOD, LOQ as per ICH guidelines. The developed method was successfully used for the quantitative analysis of commercial available dosage form.
Levalbuterol Hydrochloride (also known as Levosalbutamol Hydrochloride) is the R -enantiomer of short acting β2-adrenergic receptor agonist of Salbutamol (Albuterol). Chemically it is designated as (R)-α1-[[(1,1-dimethylethyl) amino] methyl]-4-hydroxy-1,3-benzenedimethanol hydrochloride. Chemical structure of Levalbuterol Hydrochloride is shown in Figure no.1. Levalbuterol leads to activation of β2-adrenergic receptors on airways smooth muscle resulting in muscle relaxation and bronchodilatation. Levalbuterol relaxes the smooth muscle of all airways, from the trachea to the terminal bronchioles. Levalbuterol Hydrochloride is a highly selective β2 agonist; cardiac side effects are less prominent. Selectivity is further increased by inhaling the drugs. Inhaled Levalbuterol Hydrochloride is used to abort and terminate attacks of asthma. [1,2]
Figure no. 1: Chemical structure of Levosalbutamol Hydrochloride
Budesonide is designated chemically as (RS)-11-β, 16-α, 17, 21-tetrahydroxypregna-l, 4-diene-3,20-dionecyclic 16, 17-acetalbutyraldehyde. [3] Chemical structure of Budesonideis shown in Figure no. 2. Budesonide is a second-generation glucocorticoid, exhibits high affinity to the corticosteroid receptors with a high ratio of topical to systemic anti-inflammatory activity. Glucocorticoids have effects such as gluconeogenesis, proteolysis, lipolysis, suppression of inflammation and immune responses. Budesonide exhibits potent topical anti-inflammatory effects as a glucocorticoid and undergoes significant first-pass metabolism, making it well-suited for localized IBD therapy. Beyond IBD, has also been employed in treating various clinical conditions, including asthma [4], allergic rhinitis [5], and eosinophilic esophagitis [6], owing to its potent local anti-inflammatory action and favorable degradation in the upper gastrointestinal tract, which restricts its effective delivery to the colon [7]. The therapeutic success of Budesonide in ulcerative colitis hinges on overcoming GI barriers through the development of advanced colon-targeted delivery systems that enable localized, controlled release at the site of inflammation [8].
Figure no. 2: Chemical structure of Budesonide
The literature review described HPLC, UV-Visible spectrophotometric, LC-MS method for determination of Budesonide individually and combination with other drugs in their pharmaceutical dosage form. [9-14]
MATERIAL AND METHODS:
1.2.1 Instrumentation Chemicals and reagents:
The HPLC system consisted of Agilent connected with PDA detector. Levosalbutamol Hydrochloride and Budesonide standard gift samples were provided by Aadhaar Life Science Pvt. Ltd. Solapur. Methanol, acetonitrile and water (HPLC grade) were purchased from Merck Chemical Company. Sodium hexane Sulphonic acid, glacial acetic acid (Analytical grade) and 0.22 μm pump Nylon filter were purchased from S.D. Fine Chemicals Ltd., Mumbai. The Whatman filter paper No. 41 was obtained from Modern Science Lab. All other reagents used were analytical grade. All the glassware used were borosilicate glass. Respules formulations (Budesal respules) were obtained from the local market.
1.2.2 Chromatographic Conditions:
1.3 Standard Preparation:
i. Prepare a Standard Stock Solution (SSS-I) of by adding 12.5 mg of Levosalbutamol hydrochloride in 100 ml volumetric flask & add 50 ml diluent, sonicate for 5 minutes and make the volume to 100 ml with diluent. (Conc. of Levosalbutamol hydrochloride in SSS-I = 125 µg/ml).
ii. Prepare a Standard Stock Solution (SSS-II) of by adding 5 mg of Budesonide in 100 ml volumetric flask & add 50 ml diluent, sonicate for 5 minutes and make the volume to 100 ml with diluent. (Conc. of Budesonide in SSS-II = 50 µg/ml).
1.4 Preparation of Drug Product sample solution:
The drug product sample solution was prepared by taking sample equivalent to 1.25 mg of Levosalbutamol hydrochloride and 0.5 mg of Budesonide accurately in 100 ml volumetric flask and 50-70 diluent was added to it and sonicated for 5 minutes and made up to the mark with diluent.
1.5 Selection of Wavelength:
The sample was scanned from 190-400 nm with DAD detector. The Wavelength selected for analysis chosen was 239 nm on the basis of isosbestic point.
1.6 Method Validation:
a. Specificity & Assay:

b. Repeatability& System Suitability:
i. A single working standard was prepared as described in section 2 and 6 injections were made from same solution and checked for system suitability.
ii. System suitability parameters are as below:
c. Linearity & Range:
i) 5 samples of varying concentrations ranging from 80-120% were prepared.
ii) The concentrations are given below
Table no.: 1. Concentration for linearity Study of for HPLC
|
% Level |
Levosalbutamol hydrochloride Conc. (µg/ml) |
Budesonide Conc. (µg/ml) |
|
80 |
10 |
4.0 |
|
90 |
11.25 |
4.5 |
|
100 |
12.5 |
5.0 |
|
110 |
13.75 |
5.5 |
|
120 |
15 |
6.0 |
iii. The sample preparations are given as below;
X ml of Levosalbutamol hydrochloride and Y ml of Budesonide standard solution was added to 10 ml diluent to make up the concentrations given above:
|
X ml of SSS-I |
X ml of SSS-II |
Diluted to |
|
0.8 |
0.8 |
10 ml |
|
0.9 |
0.9 |
10 ml |
|
1.0 |
1.0 |
10 ml |
|
1.1 |
1.1 |
10 ml |
|
1.2 |
1.2 |
10 ml |
d. Accuracy:
i. Samples were prepared of 80%, 100% and 120% concentration by spiking the same amount of concentration given in table for Linearity.
ii. Samples were injected in triplicate to calculate % RSD.
iii. % Recovery was also calculated.
e. LOD/ LOQ:
Was calculated by using ANOVA technique.
Formula:


f. Robustness:
i. The Robustness was performed by changing the column temperature and Wavelength by ± 2˚C and ± 2 nm.
ii. Each Sample was injected and % RSD of peak area was calculated at each condition.
Table no. 2 Column Oven Temperature Robustness Study.
|
Condition |
Increased |
Normal |
Decreased |
|
Column Oven Temperature |
32˚C |
30˚C |
28˚C |
|
Wavelength |
266 nm |
264 nm |
262 nm |
g. Intra & Inter-day Precision:
i) Single mixture working standard and drug product was prepared and injected twice in a day at different time intervals to evaluate intra-day precision.
ii) Same mixture working standard was analysed on second day to evaluate the inter-day precision.
iii) % RSD of peak was calculated at each interval and stability of solutions were estimated.
RESULT AND DISCUSSION:
i) Selection of analytical wavelength:
The sample was scanned from 190-400 nm with DAD detector. The Wavelength selected for analysis chosen was 239 nm on the basis of isosbestic point.
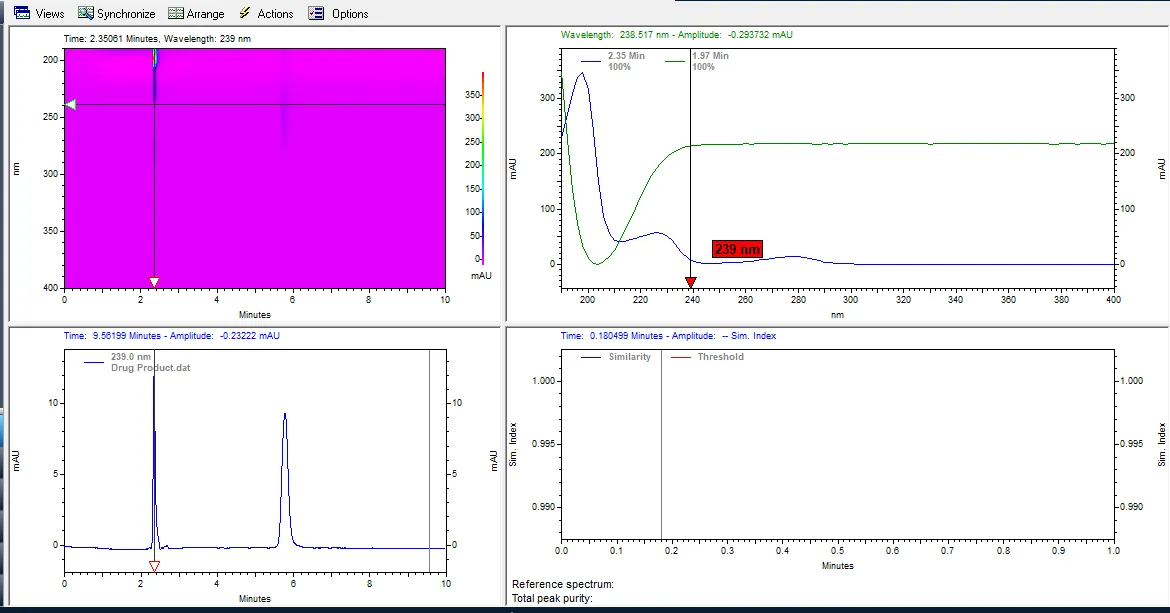
Figure no.3: Spectrum of Levosalbutamol Hydrochloride and Budesonide between 200-400 nm in mobile phase
Levosalbutamol Hydrochloride RT 2.34 min and Budesonide RT 5.78 min show the maximum absorbance at 264 nm. Hence, HPLC analysis was carried out at 264 nm. (Figure.1)
Table no. 1Details of Various trial of mobile phase for mixture containing Levosalbutamol Hydrochloride and Budesonide.
|
Trial No. |
Mobile Phase |
Ratio |
Wavelength |
Levosalbutamol Hydrochloride |
Budesonide |
||||
|
RT |
TP |
Asymmetry |
RT |
TP |
Asymmetry |
||||
|
1 |
0.1% Perchloric Acid: Acetonitrile |
50-50 |
250 nm |
1.97 |
6501 |
1.20 |
8.87 |
9221 |
1.15 |
|
2 |
0.1% Perchloric Acid: Acetonitrile |
40-60 |
239 nm |
1.89 |
6839 |
1.34 |
5.27 |
7049 |
1.14 |
|
3 |
0.1% Perchloric Acid: Acetonitrile |
40-60 |
239 nm |
2.32 |
8287 |
2.17 |
5.21 |
5184 |
1.06 |
|
4 |
0.1% Perchloric Acid: Acetonitrile |
35-65 |
239 nm |
2.34 |
8839 |
1.23
|
5.78 |
6103 |
1.13 |
Final Method: Zorbax Bonus-RP (4.6x 250mm 5um), at 1 ml/min flow rate, detection wavelength is 239 nm, mobile phase containing 0.1% Perchloric Acid: Acetonitrile in ratio of 35:65.
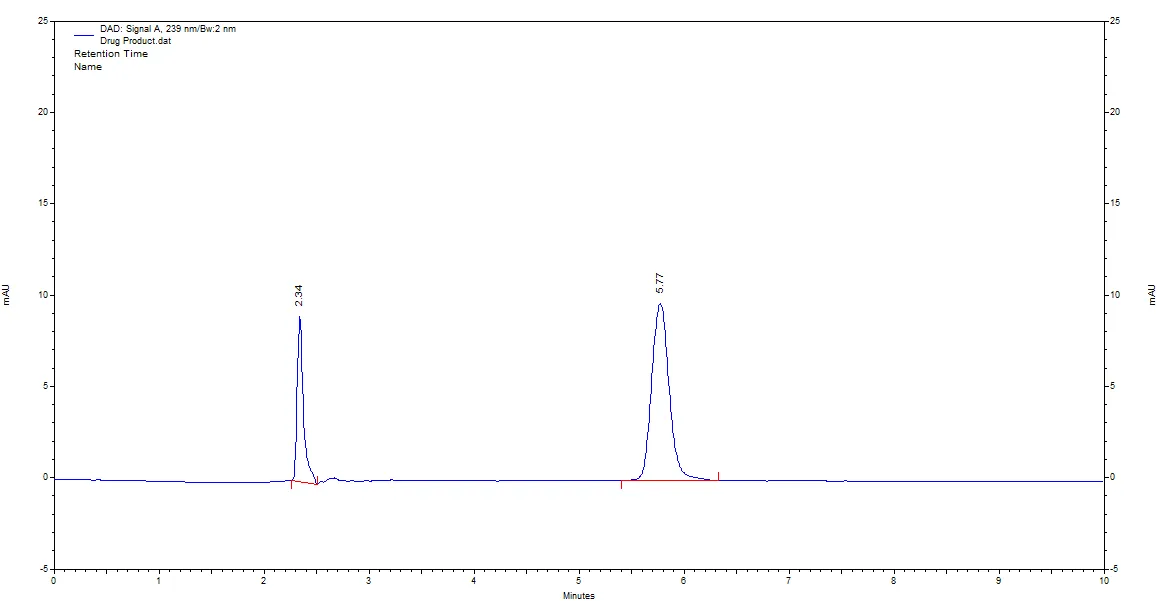
Figure no.4: Chromatogram of Standard Mixture of Levosalbutamol Hydrochloride and Budesonide in optimized chromatographic conditions.
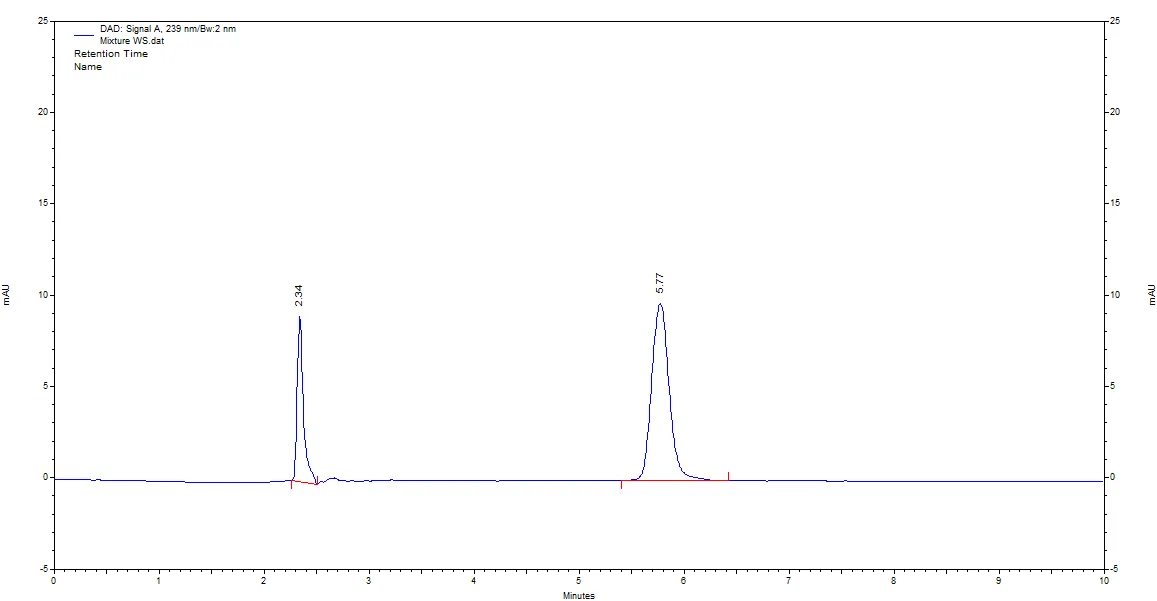
Figure no.5: Chromatogram of Sample of Levosalbutamol Hydrochloride and Budesonide in optimized chromatographic conditions.
Table no. 2: Details of chromatogram of standard mixture containing Levosalbutamol Hydrochloride and Budesonide.
|
Sr. No |
Name of drug |
RT (min) |
Plates |
Tailing factor |
|
1. |
Levosalbutamol Hydrochloride |
2.34 ± 0.5 min |
8839 |
1.20 |
|
2. |
Budesonide |
5.78 ± 0.5 min |
6103 |
1.33 |
iii) Analysis of tablet formulation: -
Table no.3 Analysis of marketed formulation.
|
Sample ID |
Levosalbutamol hydrochloride |
Budesonide |
||||
|
RT |
Area |
% Assay |
RT |
Area |
% Assay |
|
|
LSB WS |
2.34 |
79249 |
- |
- |
- |
- |
|
BDS WS |
- |
- |
- |
5.77 |
237150 |
- |
|
MIX WS |
2.34 |
79253 |
- |
5.77 |
237253 |
- |
|
Drug Product |
2.34 |
79258 |
100.01 |
5.77 |
237257 |
100.00 |
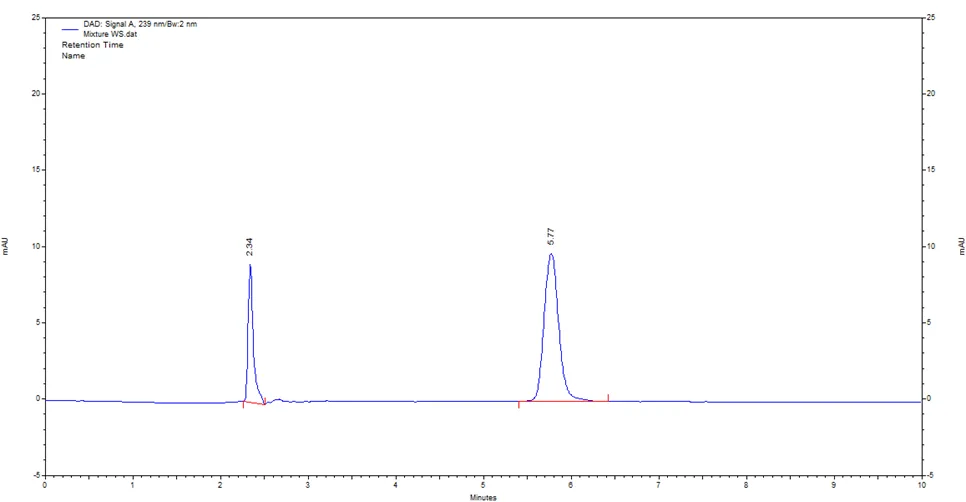
Figure no 6. Chromatogram of Levosalbutamol Hydrochloride and Budesonide in tablet formulation.
Amount of drug present in the marketed formulation was calculated using RP-HPLC. Amount of Levosalbutamol Hydrochloride and Budesonide was found to be 100.01 &100% respectively. This method can be employed for routine analysis of Levosalbutamol Hydrochloride and Budesonide. The result of assay of marketed formulation are given in Table 7.10. The separation was achieved by Zorbax Bonus-RP (4.6x 250mm 5um) column, at 1 ml/min flow rate, detection wavelength is 239 nm, mobile phase containing 0.1% Perchloric Acid: Acetonitrile in ratio of 35:65. The detection was carried out at 239 nm.
The retention time of Levosalbutamol Hydrochloride and Budesonide was found to be 2.34 ± 0.5 min and 5.78 ± 0.5 min respectively.
After establishing the chromatographic conditions, analysis of tablet formulation was done. The results are given in (Table 3& Figure 6)
1.8) Validation Of RP-HPLC Method: [15-19]
A. Linearity: Different concentration of solution prepared for Linearity of both Levosalbutamol Hydrochloride and Budesonide are shown in (Table -4 and Table -5) calibration curves are shown in Figure 7& 8 respectively.
Table no.4 Linearity dilutions for Levosalbutamol Hydrochloride.
|
Levosalbutamol Hydrochloride |
||
|
% Level |
Conc. (µg/ml) |
Area |
|
80 |
10 |
65055 |
|
90 |
11.25 |
71849 |
|
100 |
12.5 |
79249 |
|
110 |
13.75 |
85776 |
|
120 |
15 |
92885 |
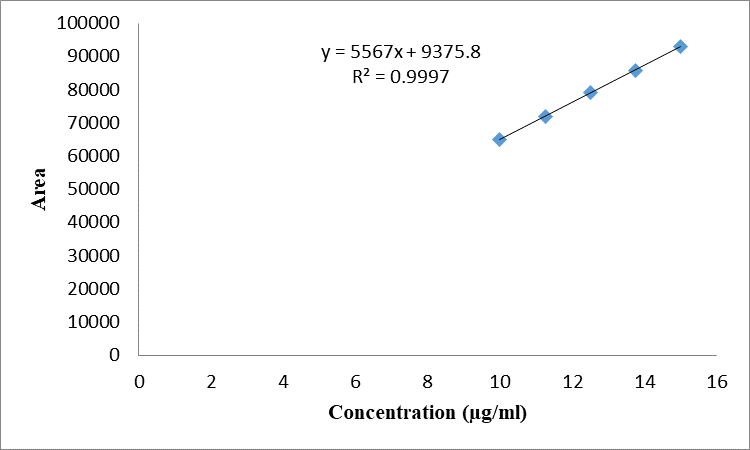
Figure no.7Calibration curve of Levosalbutamol Hydrochloride.
Table no.5 Linearity dilutions for Hydrochlorothiazide.
|
Budesonide |
||
|
% Level |
Conc. (µg/ml) |
Area |
|
80 |
4 |
189932 |
|
90 |
4.5 |
214000 |
|
100 |
5 |
237150 |
|
110 |
5.5 |
261584 |
|
120 |
6 |
284498 |
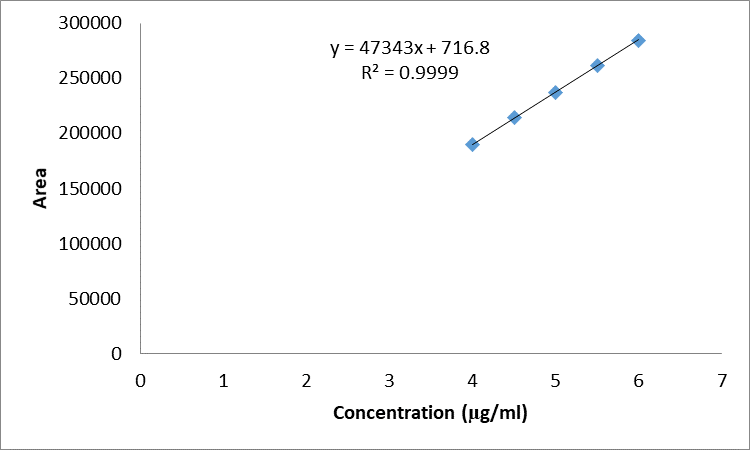
Figure no.8 Calibration curve of Hydrochlorothiazide.
According to ICH guideline linearity of an analytical procedure is its ability (within a given range) to obtain test results which are directly proportional to the concentration of an analyte Linearity was studied by plotting a graph of area v/s concentration. A series standard solution of Levosalbutamol Hydrochloride and Budesonide were prepared in the concentration range of 10 μg/ml to 15 μg/mL and 4 μg/mL to 6 μg/mL respectively with linearity range 80-120% for both the drug and is shown in Table 4 and 5. The regression coefficient (r2) of Levosalbutamol Hydrochloride was found to be 0.999 & for Budesonideregression coefficient (r2) was found to be 0.999. The equation of regression line for Levosalbutamol Hydrochloride was found to be y=5567x + 9375.8 for Budesonide was found to be y=47343x+716.8 Linearity graph of Levosalbutamol Hydrochloride and Budesonide shown in figure 8&9 respectively.
B. Precision:
The Precision study of Levosalbutamol Hydrochloride and Budesonideare shown Table 7.13 respectively.
Table no. 6Precision of Levosalbutamol Hydrochloride and Budesonide.
|
Levosalbutamol Hydrochloride |
||||
|
Condition |
Sample ID |
RT |
Area |
% Assay |
|
Morning |
WS |
2.34 |
79253 |
- |
|
DP |
2.34 |
79258 |
100.01 |
|
|
Evening |
WS |
2.34 |
79245 |
- |
|
DP |
2.34 |
79265 |
100.03 |
|
|
% RSD |
0.01 |
|||
|
Day 2 |
WS |
2.34 |
79262 |
- |
|
DP |
2.34 |
79264 |
100.00 |
|
|
% RSD |
0.01 |
|||
|
Budesonide |
||||
|
Condition |
Sample ID |
RT |
Area |
% Assay |
|
Morning |
WS |
5.77 |
237253 |
- |
|
DP |
5.77 |
237257 |
100.00 |
|
|
Evening |
WS |
5.77 |
237345 |
- |
|
DP |
5.77 |
237129 |
99.91 |
|
|
% RSD |
0.07 |
|||
|
Day 2 |
WS |
5.77 |
237147 |
- |
|
DP |
5.77 |
237045 |
99.96 |
|
|
% RSD |
0.05 |
|||
The Precision of test results is ensured by intraday and interday precision. Levosalbutamol Hydrochloride and Budesonideboth had % RSD values less than 2. Results are shown in Table 6.
C. Accuracy: The accuracy study of Levosalbutamol Hydrochloride and Budesonideare shown in Table 7 and 8 respectively.
Table no. 7. Accuracy Study of Levosalbutamol Hydrochloride.
|
Levosalbutamol |
|||
|
Std. wt. (mg) |
% Purity |
Std. Stock Conc. (µg/ml) |
Working Std. Area |
|
12.5 |
99.9 |
124.875 |
79253 |
|
Sample ID |
Reps |
Spiked Conc. (µg/ml) |
Area |
Amount Recovered (µg/ml) |
% Recovery |
AVG |
STDEV |
% RSD |
|
80% |
Rep 1 |
9.99 |
85055 |
13.40 |
134.15 |
134.14 |
0.035491 |
0.03 |
|
Rep 2 |
9.99 |
85065 |
13.40 |
134.17 |
||||
|
Rep 3 |
9.99 |
85022 |
13.40 |
134.10 |
||||
|
100% |
Rep 1 |
12.49 |
79249 |
12.49 |
99.99 |
100.00 |
0.007025 |
0.01 |
|
Rep 2 |
12.49 |
79256 |
12.49 |
100.00 |
||||
|
Rep 3 |
12.49 |
79245 |
12.49 |
99.99 |
||||
|
120% |
Rep 1 |
14.99 |
92885 |
14.64 |
97.67 |
97.67 |
0.007385 |
0.01 |
|
Rep 2 |
14.99 |
92879 |
14.63 |
97.66 |
||||
|
Rep 3 |
14.99 |
92893 |
14.64 |
97.68 |
Table no.8Accuracy Study of Budesonide.
|
Budesonide |
|||
|
Std. wt. (mg) |
% Purity |
Std. Stock Conc. (µg/ml) |
Working Std. Area |
|
5 |
99.9 |
49.95 |
237253 |
|
Sample ID |
Reps |
Spiked Conc. (µg/ml) |
Area |
Amount Recovered (µg/ml) |
% Recovery |
AVG |
STDEV |
% RSD |
|
80% |
Rep 1 |
4.00 |
189932 |
4.00 |
100.07 |
100.05 |
0.027093 |
0.03 |
|
Rep 2 |
4.00 |
189845 |
4.00 |
100.02 |
||||
|
Rep 3 |
4.00 |
189936 |
4.00 |
100.07 |
||||
|
100% |
Rep 1 |
5.00 |
237150 |
4.99 |
99.96 |
99.97 |
0.018571 |
0.02 |
|
Rep 2 |
5.00 |
237230 |
4.99 |
99.99 |
||||
|
Rep 3 |
5.00 |
237158 |
4.99 |
99.96 |
||||
|
120% |
Rep 1 |
5.99 |
284498 |
5.99 |
99.93 |
99.92 |
0.006188 |
0.01 |
|
Rep 2 |
5.99 |
284477 |
5.99 |
99.92 |
||||
|
Rep 3 |
5.99 |
284463 |
5.99 |
99.92 |
The method's accuracy defines how close the method's results are to the true value. The results of the accuracy testing revealed that the technique is accurate within acceptable ranges. When the % RSD for Levosalbutamol Hydrochloride and Budesonideis calculated, all of the results are within acceptable bounds. A maximum RSD of 2.0% indicated acceptable accuracy within the range. The results are shown in Table 7 and 8. According to the Accuracy research, the percent recovery of Levosalbutamol Hydrochlorideis 97.67-134.14 % and Budesonide is 99.92-100.05 %, both of which are within the ICH standards.
D. Limit of Detection (LOD) and Limit of Quantification (LOQ):
The LOD and LOQ of Levosalbutamol Hydrochloride and Budesonideare shown in Table 9.
Table no.9 The LOD and LOQ of Levosalbutamol Hydrochloride and Budesonide.
|
Sr. No |
Name of drug |
LOD (μg/mL) |
LOQ(μg/mL) |
|
1.
|
Levosalbutamol Hydrochloride |
0.39 |
1.18 |
|
2. |
Budesonide |
0.09 |
0.27 |
Sensitivity of the method was determined with respect to limit of detection (LOD) and the quantification limit of an individual analytical procedure is the lowest amount of an analyte in a sample which can be quantitatively determined with the suitable precision and accuracy. LOD and LOQ value for Levosalbutamol Hydrochloride was found to be 0.39μg/mL and 1.18 μg/mL, LOD and LOQ value for Budesonide was found to be 0.09 μg/mL and 0.27μg/mL respectively. Results are shown in Table 9.
E. System suitability:
System suitability data of Levosalbutamol Hydrochloride and Budesonidegiven in below Table Table 10.
Table no. 10System suitability parameter of Levosalbutamol Hydrochloride.
|
Levosalbutamol Hydrochloride |
|||||
|
Sample ID |
Area |
RT |
TP |
Asymmetry |
Resolution |
|
100% Rep 1 |
79249 |
2.34 |
8715 |
1.19 |
0.00 |
|
100% Rep 2 |
79254 |
2.34 |
8724 |
1.20 |
0.00 |
|
100% Rep 3 |
79274 |
2.34 |
8745 |
1.24 |
0.00 |
|
100% Rep 4 |
79255 |
2.34 |
8766 |
1.30 |
0.00 |
|
100% Rep 5 |
79246 |
2.34 |
8723 |
1.26 |
0.00 |
|
100% Rep 6 |
79219 |
2.34 |
8792 |
1.23 |
0.00 |
|
AVG |
79250 |
2.34 |
|||
|
STDEV |
17.85217 |
0 |
|||
|
% RSD |
0.02 |
0.00 |
|||
Table no. 11System suitability parameter of and Budesonide.
|
Budesonide |
|||||
|
Sample ID |
Area |
RT |
TP |
Asymmetry |
Resolution |
|
100% Rep 1 |
237150 |
5.77 |
6090 |
1.15 |
17.33 |
|
100% Rep 2 |
237156 |
5.77 |
6075 |
1.11 |
17.23 |
|
100% Rep 3 |
237268 |
5.77 |
6098 |
1.12 |
16.54 |
|
100% Rep 4 |
237256 |
5.77 |
6074 |
1.14 |
16.22 |
|
100% Rep 5 |
237085 |
5.77 |
6049 |
1.11 |
17.42 |
|
100% Rep 6 |
237169 |
5.77 |
6047 |
1.13 |
14.45 |
|
AVG |
237181 |
5.77 |
|||
|
STDEV |
69.48285 |
0 |
|||
|
% RSD |
0.03 |
0.00 |
|||
The system, method, and column performance were validated by testing system suitability features. Six times, a standard solution of Levosalbutamol Hydrochloride and Budesonidewas injected into the system, and the system's suitable features were evaluated. Results are shown in Table 10 and 11.
F. Robustness: Robustnessdataof Levosalbutamol Hydrochloride and Budesonidegiven in below
Table no.12Robustnessparameter of Levosalbutamol Hydrochloride.
|
Variation in Column temperature (Levosalbutamol Hydrochloride) |
|||||||
|
Condition |
Sample ID |
RT |
Area |
% Assay |
Average |
STDEV |
% RSD |
|
28C |
WS |
2.34 |
79145 |
- |
100.09 |
0.152636 |
0.15 |
|
DP |
2.34 |
79144 |
100.00 |
||||
|
30C |
WS |
2.34 |
79253 |
- |
|||
|
DP |
2.34 |
79258 |
100.01 |
||||
|
32C |
WS |
2.34 |
79456 |
- |
|||
|
DP |
2.34 |
79668 |
100.27 |
||||
|
Variation in wavelength ((Levosalbutamol Hydrochloride) |
|||||||
|
Condition |
Sample ID |
RT |
Area |
% Assay |
Average |
STDEV |
% RSD |
|
237 nm |
WS |
2.34 |
79265 |
- |
100.04 |
0.065602 |
0.07 |
|
DP |
2.34 |
79358 |
100.12 |
||||
|
239 nm |
WS |
2.34 |
79253 |
- |
|||
|
DP |
2.34 |
79258 |
100.01 |
||||
|
241 nm |
WS |
2.34 |
79246 |
- |
|||
|
DP |
2.34 |
79247 |
100.00 |
||||
Table no.13 Robustnessparameter of Budesonide.
|
Variation in Column temperature (Budesonide) |
|||||||
|
Condition |
Sample ID |
RT |
Area |
% Assay |
Average |
STDEV |
% RSD |
|
28C |
WS |
5.77 |
237125 |
- |
100.00 |
0.01262 |
0.01 |
|
DP |
5.77 |
237145 |
100.01 |
||||
|
30C |
WS |
5.77 |
237253 |
- |
|||
|
DP |
5.77 |
237257 |
100.00 |
||||
|
32C |
WS |
5.77 |
237456 |
- |
|||
|
DP |
5.77 |
237418 |
99.98 |
||||
|
Variation in Column temperature (Budesonide) |
|||||||
|
Condition |
Sample ID |
RT |
Area |
% Assay |
Average |
STDEV |
% RSD |
|
237 nm |
WS |
5.77 |
237845 |
- |
99.95 |
0.095767 |
0.10 |
|
DP |
5.77 |
237456 |
99.84 |
||||
|
239 nm |
WS |
5.77 |
237253 |
- |
|||
|
DP |
5.77 |
237257 |
100.00 |
||||
|
241 nm |
WS |
5.77 |
237252 |
- |
|||
|
DP |
5.77 |
237259 |
100.00 |
||||
Robustness was investigated using various deliberate alterations in chromatographic settings, such as changes in column Condition like 28˚C, 30˚C and 32˚C.
% RSD was shown to be less than 2% in the Levosalbutamol Hydrochloride and Budesoniderobustness studies. As a result, it is strong and adheres to ICH criteria. Results are shown in Table 12 and 13.
CONCLUSION:
Levosalbutamol Hydrochloride and Budesonide may be easily and quickly quantified from their formulations using the RP-HPLC method that has been developed and validated. Every validation parameter was determined to be within the permissible ranges in compliance with ICH criteria. Regardless of the excipients present, the proposed method was found to be straightforward, accurate, exact, robust, and resilient. It was also shown to be specific for the pharmaceuticals of interest. It can be applied to the regular examination of commercially available formulations.
REFERENCES

Samrat Khedkar, Mahesh Pingale, Sushant Yedage*, Analytical Method Development and Validation of RP-HPLC Method for Simultaneous Estimation of Levosalbutamol Hydrochloride and Budesonide in Bulk and Pharmaceutical Dosage Form, Int. J. Med. Pharm. Sci., 2026, 2 (7), 747-760. https://doi.org/10.5281/zenodo.21396482
 10.5281/zenodo.21396482