
We use cookies to ensure our website works properly and to personalise your experience. Cookies policy
Sheat College of Pharmacy, Varanasi (U.P)
The present investigation aims to develop and evaluate sustained release matrix tablets of Repaglinide and Miglitol using processed Aloe vera mucilage as a natural release modifier. Both drugs are widely used in the management of Type 2 diabetes mellitus but suffer from short biological half-lives and require frequent administration. The study explores the potential of Aloe vera mucilage as a hydrophilic matrix-forming agent to prolong drug release. Matrix tablets were formulated using wet granulation technique and evaluated for pre-compression and post-compression parameters. In vitro drug release studies demonstrated sustained drug release up to 12 hours. Release kinetics indicated that drug release followed Higuchi diffusion model with non-Fickian transport mechanism. The results suggest that Aloe vera mucilage is an effective, economical, and biocompatible alternative to synthetic polymers for sustained drug delivery.
Diabetes mellitus is a chronic endocrine disorder characterized by hyperglycemia due to insulin deficiency or resistance. Repaglinide, a short-acting insulin secretagogue, stimulates pancreatic β-cells, while Miglitol, an alpha-glucosidase inhibitor, delays carbohydrate digestion and glucose absorption in the intestine. Despite their effectiveness, both drugs exhibit short elimination half-lives, necessitating multiple daily dosing, which reduces patient compliance. Natural polymers have gained attention due to their biodegradability, safety, and availability. Aloe vera mucilage contains polysaccharides that swell in aqueous environments, forming a gel-like matrix capable of controlling drug diffusion. This property makes it a promising release modifier in SR formulations.
MATERIAL AND METHODS
METHODOLOGY
Drug Study
Aloe Vera mucilage extraction
Matrix tablets preparation:
Various tablet formulations will be made with various drugs: 1:1, 1:2, 1:3, 1:4, 1:5 are the polymer ratios. Before compression, the powder blend was examined.
Experimental Studies on Aloe Vera Extraction of mucilage:
A range of procedures were used to extract aloe Vera mucilage. To begin, plant leaves were collected and thoroughly cleaned in clean water to eliminate dirt and debris. For the release of mucilage in water, cutting of leaves and placement in water for 5-6 hours was done. It was then boiled for 30 minutes and left to stand for 1 hour. This causes precipitation of the mucilage, three liters of acetone. No. 80 sieve was used to sieve the powder after drying, before being stored in a desiccator. Before tablet compression, the mucilage was tested for flow characteristics.
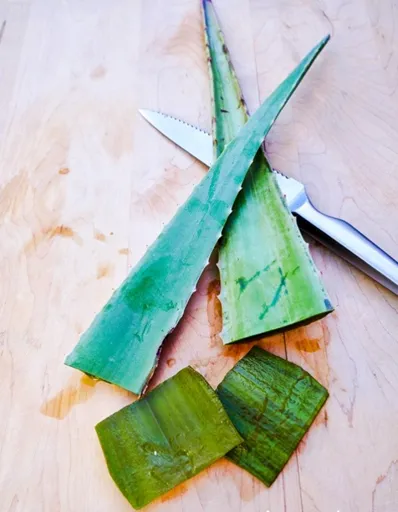


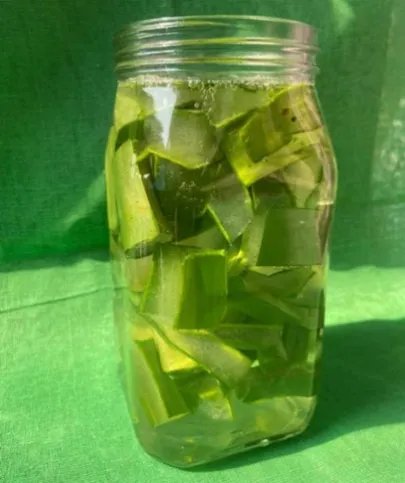


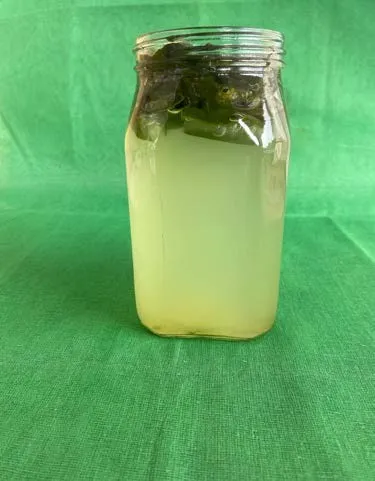


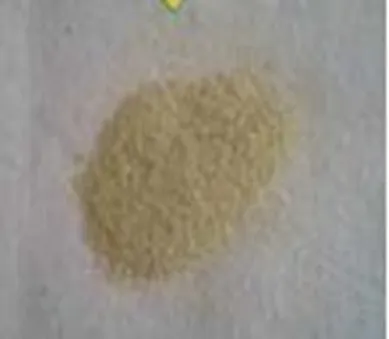
Fig 24: Procedure of extraction
Mucilage from A. barbadensis has physicochemical and microbiological characteristics
Mucilage from A. barbadensis has physicochemical and microbiological characteristics. Percentage yield, chemical test, particle size, weight loss on drying, solubility, viscosity, pH, swelling index, bulk and tapped density, angle of repose, compression characteristics, and microbial load were all investigated in dried mucilage. The 1 H-NMR spectrum in Figure 29 clearly shows that the A. vera gel material employed in this work contains the three primary marker components alovera rose, glucose, and malic acid, allowing it to be positively identified. Low quantities of lactic acid and succinic acid were also found in the findings.
A chemical test was performed. Molisch's reagent and ruthenium red were used to treat the dried mucilage powder. Positive staining was seen in both the test which showed presence of mucilage.
Drying causes weight loss. For an acceptable quantity of mucilage, weight loss on drying was assessed at 105 °C for 2 h. 86 For dried mucilage the weight loss was 4.89%.
Size of the particle: The microscopic approach was used to determine the particle size of the dried-powder mucilage, and the investigation was done in triplicate.
The solution's pH: pH metre for evaluation of pH of the 1 percent solution. (0.5-7.0)
Density: Dried mucilage was dissolved in a 0.5 percent weight/volume (w/v) solution and transferred to a density-measurement vial. Weighing an empty bottle of distilled water the dried mucilage's density was determined.
Charring: In a melting-point device, a few milligrames of dried mucilage were inserted. When the material began to char, the temperature was collected and recorded. (220OC)
Ratio of swelling: A 100-mL stoppered graduated cylinder was used for the experiment. The initial bulk volume of dried mucilage was measured at 1 g. A suitable amount of water was added to produce a uniform dispersion of 100 ML. Remaining amount of swelled mass was noted after 24 hours of storage at room temperature. The swelling ratio was obtained by multiplying the ratio of the swollen with the ratio of the non-swollen.90

Fig. 25: Bulk density apparatus
Density in bulk and tapped
The volume of dried mucilage put into a graduated cylinder was measured after it was pre-weighed and sieved. The powder-bed volume was tapped until it reached a minimal value, and the tapped volume was noted. Determination of the bulk and tapped densities were done.91
The Hausner ratio and Carr's index- Calculation was done by the bulk and tapped densities.104-105
Table 7: Significance of Carr’s index
|
S. No. |
Carr's Index |
Properties |
|
1 |
5-12 |
Free flowing |
|
2 |
13-16 |
Good |
|
3 |
18-21 |
Fair |
|
4 |
23-35 |
Poor |
|
5 |
33-38 |
Very poor |
|
6 |
>40 |
Extremely poor |
Viscosity: Various concentrations (0.1–0.5 percent w/v) of dried mucilage were made in distilled water for rheological tests. Measurement of the viscosities were doneby an Ostwald viscometer and sodium CMC solutions at the same concentration range was used for comparison.
Hausner’s Ratio:
It's estimated by taking measurements of (1) the powder's initial apparent volume, V0 and (2) the final tapped volume, Vf, after tapping the material till no change in volume is seen.
|
Hausner's Ratio= |
ρ tapped |
|
|
ρ bulk |
Table 8: Significance of Hausener’s Ratio
|
S. No. |
Hausner's Ratio |
Property |
|
1 |
0-1.2 |
Free flowing |
|
2 |
1.2-1.6 |
Cohensive powder |
The repose angle: By fixed-height funnel method and following equation calculation was done.
Angle of Repose = Tan-1 (12h/D)
Where h = height of the powder heap, and radius of the powder heap = r.
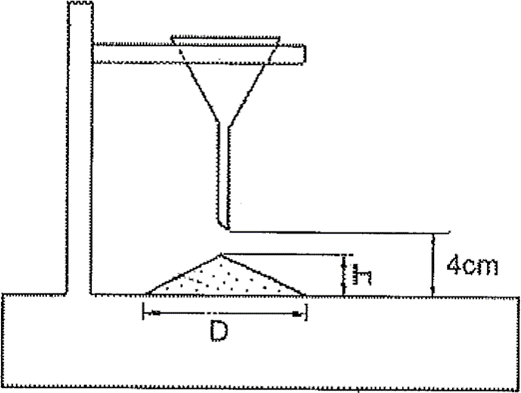
Fig. 26: Funnel method for determination of angle of repose
Table 9: Significance of Angle of Repose
|
S. No. |
Angle of repose |
Flow property |
|
1 |
<25 |
Excellent |
|
2 |
25-30 |
Good |
|
3 |
30-40 |
Passable |
|
4 |
>40 |
Poor |
Count of microbes: Plate count method as mentioned by Indian Pharmacopoeia for total aerobic microbial count of bacteria and fungus the microbiological count of the dried mucilage was evaluated. 95
Table 10: Aloe vera mucilage flow properties
|
Parameter |
Value |
|
Angle of repose |
22.5±0.32 |
|
Loose bulk density(g/cm3) |
0.72±0.07 |
|
Tapped bulk density(g/cm3) |
0.86±0.06 |
|
Carr’s index |
13.27±0.19 |
|
Hausner’s ratio |
1.191±0.02 |
Repaglinide and Miglitol was purchased. Microcrystalline cellulose was received from RSITC lab. Magnesium stearate were received from RSITC lab. Aloe vera leaves were brought from local areas of Jalgaon, Maharashtra.
Table 11: Preparation of matrix tablets containing varying ratios of PAG
|
Ingredients |
Formulation Code |
||||
|
PAG1 (mg) |
PAG2 (mg) |
PAG3 (mg) |
PAG4 (mg) |
PAG5 (mg) |
|
|
Repaglanide |
10 |
10 |
10 |
10 |
10 |
|
PAG |
15 |
30 |
45 |
60 |
75 |
|
Microcrystalline cellulose |
171 |
156 |
141 |
126 |
111 |
|
Magnesium stearate |
4 |
4 |
4 |
4 |
4 |
|
Isopropyl alcohol |
Q. S |
Q. S |
Q. S |
Q. S |
Q. S |
Reposing angle
The grains are allowed to flow freely through a funnel on a flat surface to calculate the angle of repose. Measurement of height and diameter of heaped powder and the equation was used for calculation.
Tanθ=h/r
Where h and r are the powder cone's height and radius, respectively.
Bulk density
Loose bulk density &Tapped bulk density were determined using the following formulas.
|
Weight of Granules |
|
Loose Bulk Density= |
|
Bulk Volume of Granules |
|
Weight of Granules |
|
Tapped Bulk Density= |
|
Tapped Volume of Granules |
Compressibility index: Formula used for evaluation is:
|
Tapped Density - Loose Bulk Density |
|
|
Compressibility Index = |
100 |
|
Tapped Density |
|
Drug-Excipient Compatibility Studies
FTIR Research: Figures 27 & 28 show the FT-IR spectrum of pure medicine (Repaglinide and Miglitol) and its physical mixing with various grades of polymers and excipients, demonstrating the excipient-drug compatibility.

Figure 27: FT-IR spectrum of Repaglinide and Miglitol (pure form)

Figure 28: FT IR Spectrum of PAG and Repaglinide and Miglitol
Evaluation of Tablets
The following parameters were evaluated after compression tablets are evaluated.
Dimensions (thickness and diameter)
Vernier calliper was used for the tablet's physical dimensions measurement in millimetres. Each batch included 20 tablets, and the average was computed.
Aesthetics and texture
Visual examination was used to assess the tablets' appearance, colour, shape, and texture.
Hardness
The Monsanto Hardness Tester was used to determine the hardness of the tablets.
A total of 20 tablets were chosen at random. The weight was steadily raised until the tablet shattered when the scale was reset to zero. The load at that location provides a measure of the tablet's hardness. kg/cm2 is used for its representation.
Friability
Roche fribilator was used to conduct the test. In the fribilator, 20 pre- weighed tablets were placed, the device was run for around 4 minutes at a speed of 25rpm. The percentage weight reduction was calculated after weighing the tablets again.
Formula used:
|
% Weight loss= |
(Weight)initial –(Weight)final |
100 |
|
(Weight) initial |
Variation in weight
20 tablets were chosen at random and weighed single pan balance separately and in combination. The standard deviation and the average weight was computed. If no more than two tablets go outside the % restriction and none of the tablets differ by more than double the percentage limit, the tablet passes the test. According to official techniques, all manufactured matrix tablets were assessed for weight uniformity, hardness, friability, and thickness.
Drug Content Uniformity
Pulverisation of 5 tablets were done and weighed. Powder equal to 100 mg of Repaglinide and Miglitol was weighed and placed in a 250 ml volumetric flask. 150 mL of 0.1N HCL was added, mixed well, and 25-30 mins of sonication was done. With 0.1N HCL, a volume of up to 250 ml was created. The solution was filtered, and 10 mL of the filtrate was placed in a 100 mL volumetric flask with 0.1N HCL to form the volume. The absorbance of the resultant solution was measured spectrophotometrically at the peaks at around 242 nm. The following equation was used to calculate the medication concentration in tablet powder:
|
Cu/Cs = |
Au |
dilution factor |
|
As |
Where Cu denotes the concentration of the unknown sample and Cs denotes the concentration of the standard sample.
Au Absorbance of an unknown sample
As Absorbance of the reference sample
In Vitro Drug Release Profile
Dissolution experiments were carried out at 37 0.5°C in a USP Dissolution Test Apparatus II (Paddle technique) at a 37±0.5degree C. 50 revolutions per minute was the paddle spunning rate. The dissolution test was carried out by immersion the produced (Repaglinide and Miglitol) tablets in 0.1 N HCl solutions (pH 1.2) for 2 hrs in a dissolving tank and then these tablets were placed in phosphate buffer (pH 7.4) for 2 to 12hrs. At regular intervals 5 ml of sample solution was withdrawn at predetermined time interval and filtered through 0.45µm filter paper. 5 ml of fresh equivalent media was added to the dissolving flask at each (hour) time of withdrawal. Drug content of each sample was determined by using UV spectrophotometer at 242nm for 0.1NHcl and 278 nm for phosphate buffer.
Details of dissolution test:
Dissolution test apparatus: USP II
Stirrer: Paddle type
Speed: 50 rpm
Volume of medium: 500 ml
Time interval: 2, 3,4,6,8,10 and 12 hours
Medium used: 0.1N HCl for first 2 hours and the phosphate buffer pH 7.4 from 3 to 12 hours
Temperature: 37 ± 0.50C
Kinetic Analysis of Dissolution Data
To analyze the in vitro release data various kinetic models were used to describe the release kinetics.
The zero-order rate Eq. (1) describes the systems where the drug release rate is independent of its concentration (Hadjiioannou et al., 1993).
The first order Eq. (2) describes the release from system where release rate is concentration dependent (Bourne, 2002).
Higuchi (1963) described the release of drugs from insoluble matrix as a square root of time dependent process based on Fickian diffusion Eq. (3).
C = K0 t (Eq.1)
Where, K0 is zero-order rate constant expressed in units of concentration/time and t is the time.
LogC = LogC0 - K1 t / 2.303 (Eq. 2)
Where, C0 is the initial concentration of drug and K1 is first order constant.
Q = KHt1/2 (Eq. 3)
Where, KH is the constant reflecting the design variables of the system. The dissolution data were fitted to Koresmeyer equation (Equation 4) which describes the drug release behaviour from polymer system.
Log (Mt/Mα)=log K+n log t (Eq. 4)
Where
Mt is the amount of drug release at time “t” Mα= amount of drug release after infinite time
K= release constant signifying structural and geometric characteristic of the n= diffusion exponent indicating the mechanism of drug release.
A plot of log cumulative % drug release vs. log time was made. Slope of the line was n. Case-II generally refers to the erosion of the polymeric chain and anomalous transport (Non-Fickian) refers to a combination of both diffusion and erosion controlled-drug release (Peppas, 1985)
Table 12: Diffusion Exponent and Solute Release Mechanism for Cylindrical Shape
|
Diffusion exponent (n) |
Overall solute diffusion mechanism |
|
0.45 |
Fickian diffusion |
|
0.45 < n < 0.89 |
Anomalous (non-Fickian) diffusion |
|
0.89 |
Case-II transport |
|
n > 0.89 |
Super case-Ii transport |
Characteristics of swelling
The percentage of the tablet's weight increase was used to calculate the amount of swelling. Swelling behaviour was found in all formulations. In a petridish containing 0.1 NHCL, one tablet from each formulation was preserved. The tablet was extracted after 1 hour, soaked in tissue paper, and weighed. This technique was carried out for a total of 12 hours.
|
SI= |
Mt- Mo |
×100 |
|
Mo |
was used to compute the tablet's percentage weight gain.
Where SI stands for swelling index, Mt for tablet weight at time t (h), and Mo for tablet weight at zero time.
RESULT
Characterization of Polymer Matrix
Table 14 shows the granules' assessed pre-compression parameters.
Table 14: Blend precompressive settings (n = 3)
|
Formulation code |
Loose bulk density (g/ml) |
Tapped bulk density (g/ml) |
Hausners factor |
Angle of repose (°) |
Carr’s index (%) |
|
PAG1 |
0.250±0.005 |
0.285±0.012 |
1.142±0.14 |
25.67±01.84 |
12.28±1.29 |
|
PAG2 |
0.268±0.006 |
0.304±0.015 |
1.134±0.12 |
25.78±1.54 |
11.84±1.31 |
|
PAG3 |
0.278±0.005 |
0.309±0.010 |
1.115±0.21 |
27.35±1.79 |
11.15±1.34 |
|
PAG4 |
0.262±0.004 |
0.292±0.014 |
1.114±0.14 |
27.21±1.25 |
10.27±1.39 |
|
PAG5 |
0.289±0.003 |
0.317±0.012 |
1.096±0.22 |
27.12±1.64 |
9.779±1.35 |
Evaluation Of Matrix Tablet
Table 15: Matrix tablet post compressive parameters
|
Formulation code |
Thickness (mm) n = 3 |
Weight variation (mg) n = 20 |
Hardness (kg/cm2) n = 10 |
Friability (%) n = 10 |
Drug content (%) n = 20 |
|
PAG1 |
3.6±0.1 |
203±2.01 |
6.6±0.1 |
0.077±0.31 |
99.12±0.1 |
|
PAG2 |
3.5±0.2 |
200±2.31 |
5.7±0.2 |
0.083±0.30 |
99.67±0.4 |
|
PAG3 |
3.3±0.3 |
202±3.11 |
6.2±0.1 |
0.085±0.35 |
98.96±0.3 |
|
PAG4 |
3.2±0.3 |
198±2.15 |
6.1±0.2 |
0.087±0.13 |
98.22±0.2 |
|
PAG5 |
3.2±0.1 |
197±2.24 |
6.4±0.2 |
0.081±0.32 |
98.10±0.3 |
Studies on Dissolution in vitro
Dissolution experiments were carried out at 37oC ± 0.5°C in a USP Dissolution Test Apparatus II (Paddle technique) and 50 revolutions per minute was the paddle spunning rate. The dissolution test was carried out by immersion the produced (Repaglinide and Miglitol) tablets in 0.1 N HCl solutions (pH 1.2) for 2 hrs in a dissolving tank and then these tablets were placed in phosphate buffer (pH 7.4) for 2 to 12 hrs. At regular intervals 5 ml of sample solution was withdrawn at predetermined time interval and filtered through 0.45µm filter paper .5 ml of fresh equivalent media was added to the dissolving flask at each (hour) time of withdrawal. Drug content of each sample was determined by using UV spectrophotometer at 242nm for 0.1N HCl and 278 nm for phosphate buffer. Figure 37 depicts the dissolving characteristics of several formulations.
Table 16: Dissolution characteristics of PAG 1 - PAG 5 and marketed (MKT) drug
|
Time |
Cumulative Drug Release % |
|||||
|
MKT |
PAG 1 |
PAG 2 |
PAG 3 |
PAG 4 |
PAG 5 |
|
|
0 |
0 |
0 |
0 |
0 |
0 |
0 |
|
0.5 |
8.42 |
12.15 |
10.78 |
10.22 |
6.98 |
6.54 |
|
1 |
50.53 |
25.67 |
22.28 |
21.65 |
20.67 |
20.12 |
|
2 |
66.74 |
50.89 |
30.83 |
24.17 |
22.62 |
22.56 |
|
3 |
74.56 |
68.32 |
42.92 |
32.43 |
28.23 |
25.65 |
|
4 |
80.51 |
78.71 |
60.89 |
38.54 |
32.98 |
30.28 |
|
5 |
88.15 |
89.84 |
72.65 |
52.21 |
42.78 |
36.69 |
|
6 |
90.15 |
94.73 |
84.38 |
64.66 |
53.91 |
46.65 |
|
7 |
|
|
90.97 |
74.43 |
64.17 |
56.31 |
|
8 |
|
|
96.92 |
84.98 |
72.49 |
64.73 |
|
9 |
|
|
|
89.53 |
76.72 |
70.93 |
|
10 |
|
|
|
92.89 |
85.89 |
78.91 |
|
11 |
|
|
|
|
95.29 |
89.72 |
|
12 |
|
|
|
|
|
98.89 |

Fig. 31: In-vitro dissolution of PAG 1

Fig. 32: In-vitro dissolution of PAG 2

Fig. 33: In-vitro dissolution of PAG 3
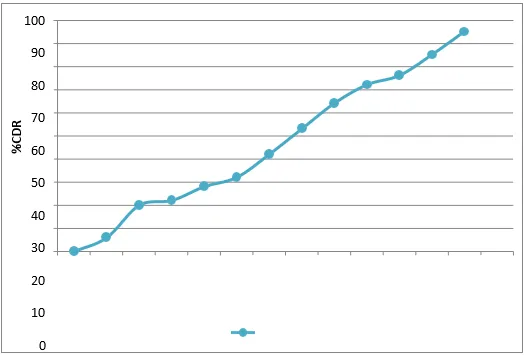
Fig. 34: In-vitro dissolution of PAG 4
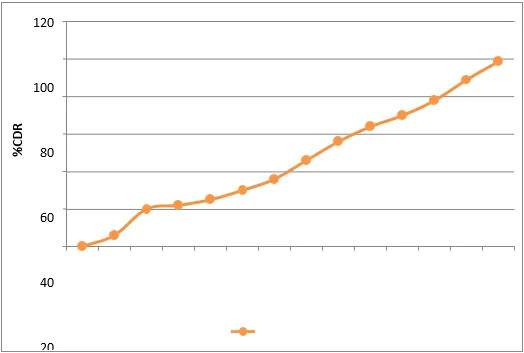
Fig. 35: In-vitro dissolution of PAG 5

Fig. 36: In-vitro dissolution of MKT (Marketed)
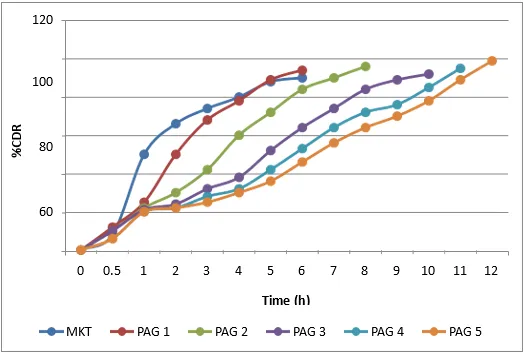
Figure 37: Dissolution characteristics of PAG1 to PAG5 Formulations
It has been shown that increasing the concentration of polymers in the formulations retards drug release from the matrices in all formulations.
The drug release data from an in-vitro dissolution research was evaluated with multiple kinetic equations to establish the mechanism of drug release from this formulation. Different kinetic equations. The information was analysed using the following criteria:
Table 17: Correlation coefficients according to different kinetic equations
|
Formulation |
Zero order |
First order |
Higuchi model |
Korsmeyer model |
|
|
|
r2 |
|
N |
r2 |
|
|
PAG1 |
0.989 |
−0.863 |
0.987 |
0.647 |
0.936 |
|
PAG2 |
0.987 |
−0.824 |
0.984 |
0.612 |
0.942 |
|
PAG3 |
0.992 |
−0.864 |
0.989 |
0.564 |
0.944 |
|
PAG4 |
0.992 |
−0.849 |
0.989 |
0.555 |
0.959 |
|
PAG5 |
0.994 |
−0.772 |
0.991 |
0.565 |
0.964 |
|
Marketed Preparation |
0.962 |
−0.642 |
0.982 |
0.5145 |
0.934 |
Drug Release Kinetics
Zero order equation, C = K0 t
First order equation, Log C = LogC0 - K1 t / 2.303 Higuchi’s equation, Q = KHt1/2
Korsmeyer’s et al equation, Log (Mt/Mα)=log K+n log t

Fig. 38: Zero order release kinetics of optimized formulation PAG 5

Fig. 39: First order release kinetics of optimized formulation PAG5

Fig. 40: Higuchi model release kinetics of optimized formulation PAG5

Fig. 41: Korsmeyer and Peppas release kinetics of optimized formulation PAG5
The swelling was calculated as a percentage of the tablet's weight increase. Swelling behaviour was found in all formulations. In a petridish containing 0.1N HCL, one tablet from each formulation was preserved. The tablet was extracted after 1 hour, soaked in tissue paper, and weighed. This technique was carried out for a total of 12 hours. SI=(Mt-Mo)/Mo100 was used to compute the tablet's percentage weight gain. Where SI stands for swelling index, Mt for tablet weight at time t (h), and Mo for tablet weight at zero time.
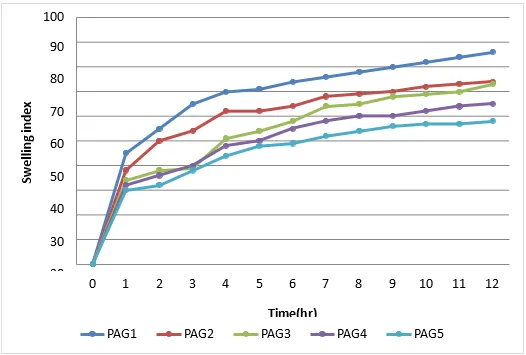
Fig 42: Swelling index of PAG1, PAG2, PAG3, PAG4, PAG5 matrix tablets
Optimized formulation PAG 5 was packed in an air tight high-density polythene bottles and kept at 450C with 755% RH for 3 months as per ICH guidelines for stability. Samples were withdrawn at 0, 30, 60 and 90 days of storage and evaluated for appearance, hardness and drug content.
Table 18: Physical and chemical properties of prepared tablets (n = 10)
|
Formulation |
Time |
Appearance |
Hardness |
Drug content |
|
PAG5 |
Initial |
Pale white |
6.0±0.12 |
99.84±0.43 |
|
30 days |
Pale white |
5.4±0.16 |
99.84±0.32 |
|
|
60 days |
Pale white |
5.4±0.16 |
99.84±0.02 |
|
|
90 days |
Pale white |
5.4±0.16 |
98.52±0.21 |
PAG – Processed Aloe vera gel
Analysis Statistically
For the data acquired, the following statistical analyses were performed:
ANOVA
Deviation from the mean
The ANOVA Methodology: The ANOVA table separates the components of data variance into treatment variation and error or residual variation. ANOVA tables are produced by statistical computing packages as part of their standard output for ANOVA, and the ANOVA table is set up as follows:
Table 19: The ANOVA table
|
Source of Variation |
Sums of Squares (SS) |
Degrees of Freedom (df) |
Mean Squares (MS) |
F |
|
Between Treatments |
SSB = Σnj (�Xj − �X)2 |
k-1 |
𝑆𝑆𝐵 𝑀𝑆𝐵 = 𝑘 − 1 |
𝑀𝑆𝐵 𝐹 = 𝑀𝑆𝐸 |
|
Error (or Residual) |
SSE = ΣΣ (X − �Xj )2 |
N-k |
𝑀𝑆𝐸 𝑀𝑆𝐵 = 𝑛 − 𝑘 |
|
|
Total |
SST = ΣΣ (X − �X)2 |
N-I |
|
|
where X denotes an individual observation, = sample mean of the jth treatment (or group), = overall sample mean, and k denotes the number of treatments or comparison groups. N denotes the total number of observations or sample size.
The ANOVA table calculations.
Summary of data
Table 20: ANOVA table 1
|
|
Treatments |
|||||
|
1 |
2 |
3 |
4 |
5 |
Total |
|
|
N |
20 |
20 |
20 |
21 |
20 |
101 |
|
X |
19.677 |
19.649 |
19.695 |
20.687 |
19.859 |
99.568 |
|
Mean |
0.9839 |
0.9825 |
0.9848 |
0.9851 |
0.993 |
0.986 |
|
X2 |
19.3598 |
19.3047 |
19.397 |
20.381 |
19.719 |
98.1616 |
|
Std. Dev. |
0.0057 |
0.0054 |
0.011 |
0.0109 |
0.0016 |
0.0085 |
Result details
Table 21: ANOVA table 2
|
Source |
SS |
df |
MS |
|
|
Between treatments |
0.0014 |
4 |
0.0003 |
F=5.51729 |
|
Within treatments |
0.0059 |
96 |
0.0001 |
|
|
Total |
0.0073 |
100 |
|
|
The f- ratio value is 5.51729. The p-value is 0.000484. The result is significant at p<.05.
DISCUSSION
Determination whether direct compression or alternative granulation procedure is affected by the mixture flowability, assortation of excipient. Aloe barbadensis is a succulent from which mucilage of aloevera is taken which pertains a yellow color. Matrix tablet preparation was done from it. 30° was the angle of repose of the mucilage which showed satisfactory flow. Flow ability of the powder blend's was inspected. A satisfactory flow was obtained The tablets were directly compressed. From the dry powdered mucilage following parameters were inspected which were as follows; angle of repose, LBD, TBD, Carr's index, and Hausner's ratio. Carr's index (percent) value seen was 9.779 ± 1.35 to 12.28 ± 1.29. Angle of repose seen was 25.67±01.84 to 27.35±1.79. Also 0.250±0.005 to 0.289±0.003 reading was seen in LBD and 0.285±0.012 to 0.317±0.012 TBD respectively. Hausner's factor was 1.096±0.22 to 1.142±0.14. Flowability was checked for the powder blend's. The results showed excellent flowability. This was further supported by lower Carr’s index values. A range till 15% depicts very good flowability. The output product was reviewed for pharmacopoeial standards. Ideal prarameters for difference in weight was obtained by the product. A steady breadth of tablet was measured. Shock proofing was obtained by The condition to be hard was>5 kg/cm2 and chances of crumpling less than 1%. An ideal amount of Repaglinide and Miglitol seen in the manufactured tablets. Checking of thickness, drug content, friability (crumping capacity), and hardness for all tablets were done, and all the parameters were found admissible. Results demonstrated. The measured variation of 197±2.24 to 203±2.01 (weight variation) was seen. Difference (% variation) on an average was unobjectionable (adequate), attributing approval of official weight test by all tablets. Difference in hardness was assessed 5.7±0.2 to 6.6 ± 0.1 kg/cm2 for 10 tablets. Crumpling capacity in percentage (friability) for 10 tablets were assessed as 0.077±0.31 to 0.087±0.13%. All of the tablet formulations had a percentage friability of less than 1%. The drug content of several batches of tablets (n = 20) was found to be consistent, ranging from 98.10±0.3 to 99.67±0.4. All of the tablet formulations' swelling indexes were calculated over time. Because the weight obtained by the tablet rose proportionally as the rate of hydration increased up to a specific limit, the swelling index increased as time passed. Later on, as the tablet's outermost gelled coating dissolves into the dissolving media, it steadily shrinks. Swelling index and polymer concentration had a direct connection, with swelling index increasing as polymer concentration rose. Figure 42 shows the swelling index of the produced tablets. The swelling index was shown to grow with time, but then decrease. In the PAG5 formulation, the proportion of edema was higher. When cumulative percentage of drug release for PAG1, PAG2, PAG3, PAG4, PAG5 were 94.73%, 96.92%, 92.89%, 95.29% and 98.89% respectively at the end of 12 h. Formulation of PAG1 failed to sustain release beyond 6 h. Among all the preparations PAG5 showed 98.89% at the end of 12 h. It was observed that cumulative percentage of drug release decreased with increase in processed aloevera concentration.
Drug release kinetics
The data were fitted to various mathematical models to evaluate the kinetics and mechanism of drug release. The coefficient (regression coefficient) obtained for zero order kinetics were seen higher (R2=0.987 to 0.994), in comparison to first order kinetics (R2=0.772 to 0.864) indicating that for all formulation drug release followed zero order kinetics. In this analysis the in vitro release profile of drug from all these formulations could be best expressed by Higuchi’s equation which relates to the drug dissolution of water-soluble drug. This is because this plot showed highest linearity (R2=0.984 to 0.991). In order to relate and confirm the diffusion mechanism the data were fitted to Korsemeyer-Peppas equation. It was observed that all these formulations showed good linearity (R2=0.936 to 0.964) with slope (n) value ranging from 0.55 to 0.647. For the preparation of PAG1 to PAG5, the mechanism of release showed behaviour of anomalous (non-Fickian) diffusion. The ratio of drug and processed aloevera matrix increases it leads to the increase in n value. Coupling of diffusion, erosion mechanism (anomalous non-Fickian diffusion) is indicated by this n value. Therefore, it can be stated that diffusion coupled with erosion might be mechanism for drug release from aloevera matrix sustained release matrix tablets of Repaglinide and Miglitol. To conclude that in order to maintain effective plasma concentration, an ideal drug release with preset kinetics must be maintained for SR tablets. This can be consummated by such tablet fabrication which would release drug in calculable and repeatable way. Frequency of drug release can be calculated by researching the biopharmaceutical and pharmacokinetic characteristics.56 After 2 hours, drug release from the produced tablets was determined to be >20 percent, with zero-order release kinetics. When tablets made with A. Vera gel mucilage were compared to marketed tablets made with A. Vera gel mucilage, the rate of drug release from the marketed preparation was higher, confirming its release retardant qualities. The diffusion process and the de-integration procedure affects drug release. The PAG1 formulation had the greatest medication release rate. Within two hours, 12.15 - 50.89% of the medication had been released. Surface erosion of the matrix tablet prior to the creation of the gel layer surrounding the tablet core has been suggested as a possible reason. When compared to commercially available tablets, PAG5: the tablet with the greatest content of Aloe Vera mucilage displayed sluggish Repaglinide and Miglitol release. The PAG5 formulation released 64.73 percent of the medication in 8 hours, compared to 80 percent in 4 hours for commercially available Repaglinide and Miglitol tablets. A notable thing to be mentioned is that this formulation had more amount of aloe vera mucilage, which inhibited or delayed drug release. Calculation of drug release for 6 hrs depicted PAG1 having 94.73%. Where as when seen for 8 hrs. in PAG2 was 96.92%. PAG 3 being third had 84.98%. PAG 4 had 72.49%. When PAG1, PAG2, PAG3, PAG4 and PAG5 formulations were compared, PAG5 had more A. vera mucilage, which worked as a release retardant. According to the stability experiments, the formulation PAG5 did not alter significantly in terms of physical appearance, hardness, or drug content. As a result, the formulation remained stable under various storage circumstances. The findings clearly show that PAG may be used to modulate medication release by employing it in different ratios. We can eventually infer from the aforementioned experiments that aloevera mucilage can delay drug release. However further in IVIVC (invitro-in vivo correltion) can be established using in vivo animal models to claim the potential use of aloevera extract mucilage as release modifier.
REFERENCES

Pranav Kumar Upadhyay, Ashish Gupta*, Development and Evaluation of Sustained Release Matrix Tablet of Repaglinide and Miglitol Using Processed Aloe Vera Mucilage as Release Modifier, Int. J. Med. Pharm. Sci., 2026, 2 (6), 169-188. https://doi.org/10.5281/zenodo.20676157
 10.5281/zenodo.20676157