

We use cookies to ensure our website works properly and to personalise your experience. Cookies policy
United College of Pharmacy, Periyanaickenpalayam, and Coimbatore – 641020.Affiliated to The Tamil Nadu Dr. M. G. R. Medical University, Chennai – 600032, Tamil Nadu
The cosmetics sector has shown steady growth over the last decade, driven by the increasing variety of skincare products. Manjistha (Rubia cordifolia) is traditionally known for its skin-brightening, anti-acne, and skin-detoxifying properties. The present study aimed to formulate Manjistha extract-loaded ethosomes and incorporate the optimized formulation into a facial serum for enhanced dermal delivery. The optimized ethosomes exhibited a particle size of 165.4 nm, PDI of 0.248, and zeta potential of −33.2 mV, indicating good stability and uniformity. Entrapment efficiency increased from 66.42% (ME1) to 85.92% (ME4). SEM confirmed spherical, smooth, discrete vesicles of approximately 200 nm with minimal aggregation. In-vitro drug release showed sustained release, with ME3 achieving 94.55% at 24 h. The optimized ethosomal formulation was incorporated into a facial serum by the cold method. The serum was smooth and homogeneous, with a light reddish-brown colour and pleasant odour. It showed a pH of 5.82, viscosity of 71.7 mPa·s, spreadability of 10.5, drug content of 96.14 ± 0.92%, and in-vitro drug release of 89.4% for ME3. Overall, the formulation demonstrated favorable physicochemical properties, good entrapment efficiency, sustained drug release, and potential for enhanced dermal delivery as a herbal skincare formulation.
The skin is the largest organ of the human body and is an important component of the integumentary system. Skin aging is a complex process influenced by ultraviolet (UV) radiation, which induces reactive oxygen species (ROS) and collagen degradation, resulting in wrinkles. [1] Herbal cosmetics contain phytochemicals derived from botanical sources that support skin health and provide protective benefits. [2] The skin consists of three major layers: epidermis, dermis, and subcutaneous tissue. The epidermis is primarily composed of stratified squamous epithelium containing keratinocytes, melanocytes, Langerhans cells, and Merkel cells. [3] Cosmetics are preparations intended to enhance appearance and maintain the health and aesthetic quality of the skin. Ayurvedic cosmetics are valued for their herbal ingredients, safety, and multifunctional benefits. [4] Facial serums are highly concentrated topical preparations containing higher levels of biologically active ingredients than conventional creams and lotions. Serums may contain active ingredients such as amino acids, ceramides, antioxidants, and other nutrients beneficial for skin health. [5] Their lightweight nature, small molecular components, and thin consistency facilitate rapid absorption, making them suitable for targeted skincare. [6]
2. MATERIALS:
List of chemicals and Equipments:
Manjistha powder from Tripal Consumer Products Pvt. Ltd, Ethanol from Zenith Trading Company, Soya lecithin from Jayam scientific company, Propylene glycol from Isochem Laboratories, petroleum ether from Nice Chemicals private limited, phosphate buffer from Alpha bioscience laboratories, cholesterol from Anj Biomedicals, isopropyl alcohol from Isochem Laboratories, glycerin from Nice chemicals private limited, sodium benzoate from Isochem Laboratories, xanthan gum from Nice chemicals private limited, Triethanolamine from Research products International, Tween 20 from Nice chemicals, Rose oil from Shelkar And Company Limited, Water bath from Sigma group of companies, Digital balance from Wensar equipments, pH meter from Wensar equipments, Viscometer from Remi equipments pvt.ltd, Sonicater from Vibronics, UV Spectrophotometer from Shimadzu, FTIR Spectrophotometer from Vibrionics, Microwave oven from Samsung, Hot plate from Bionics Scientific Technologies, Rotary evaporator from Athena Technology.[7]
3. METHODS:
3.1 Preformulation Studies:
3.1.1. Solubility studies:
Accurately weigh 1 g of dried Manjistha root powder into separate conical flasks and add 20 mL of each solvent: distilled water, 95% ethanol, methanol, 70% ethanol:30% water, and phosphate buffer. Shake at 25 ± 2°C for 24 hours, filter through Whatman No. 1 paper, and evaporate 10 mL of each filtrate to dryness. Dry the residues to constant weight, record the final weights, calculate the extractive value (%), and compare the yields to identify the most effective solvent. [43]
3.1.2. Absorption maximum:
The UV-Visible absorption spectrum of Manjistha extract was recorded in the wavelength range of 200- 400 nm. The spectrum exhibited a maximum absorbance (λmax) at approximately 220 nm,which may be attributed to π-π* transition of aromatic and conjugated compounds presents in the extract. Hence, 220 nm was selected as the analytical wavelength for the preparation of the calibration curve and further quantitative estimation. [44]
3.1.3. Calibration curve:
A standard stock solution was prepared by dissolving 10 mg of the drug in a suitable solvent and diluting to 100 mL to obtain 100 µg/mL. Different working concentrations were prepared by dilution, and the λmax was determined by scanning from 200–400 nm using the solvent as blank. Absorbance was measured at λmax using a quartz cuvette, and a calibration curve of concentration versus absorbance was plotted. The linear regression equation (y = mx + c) was obtained and used to determine the concentration of unknown samples. [45]
3.1.4. Compatibility studies:
The compatibility of Manjistha extract with the formulation excipients was evaluated using FTIR spectroscopy. Spectra of the extract, soya phosphatidylcholine, cholesterol, ethanol, propylene glycol, and optimized ethosomal face serum were recorded over 4000–400 cm⁻¹ using the KBr pellet or ATR method. The characteristic peaks of the extract were compared before and after formulation. Retention of major peaks without significant shifting, disappearance, or appearance of new peaks indicated good compatibility and stability of the extract with the excipients. [46]
3.1.5. Phytochemical screening:
the Manjistha extract was subjected to preliminary phytochemical screening using Ferric Chloride and Borntrager’s test to identify the presence of phenolic and Anthraquinones. These qualitative tests were performed based on characteristic colour changes or reactions produced by the phytochemicals present in the extract. [47]
3.2. Formulation Studies:
Table:1 Formula for formulation of ethosomes
|
Ingredients |
ME1 (1:0.25) |
ME2 (1:0.5) |
ME3 (1:0.75) |
ME4 (1:1) |
|
Manjistha powder |
2g |
2g |
2g |
2g |
|
Soya lecithin |
0.5g |
1.0g |
1.5g |
2.0g |
|
Ethanol |
5ml |
5ml |
5ml |
5ml |
|
Propylene Glycol |
2ml |
2ml |
2ml |
2ml |
|
Cholesterol |
0.20g |
0.20g |
0.20g |
0.20g |
|
Phosphate buffer |
q.s.to 20ml |
q.s.to 20ml |
q.s.to 20ml |
q.s.to 20ml |
|
Petroleum ether |
5ml |
5ml |
5ml |
5ml |
|
Isopropyl Alcohol |
5ml |
5ml |
5ml |
5ml |
3.2.1. Thin film Hydration Method
Soya lecithin and cholesterol were dissolved in petroleum ether and isopropyl alcohol, and the solvents were evaporated at 40–45°C under reduced pressure to form a thin lipid film. The film was vacuum-dried for 1–2 hours, then hydrated with Manjistha extract dissolved in ethanol and mixed with propylene glycol and phosphate buffer (pH 7.4) or distilled water. The mixture was rotated at 40–45°C for 30–60 minutes to form ethosomal vesicles, followed by sonication for 5–10 minutes to reduce vesicle size. The ethosomal suspension was stored at 4°C for 24 hours before incorporation into the face serum base. [48]
Table: 2 Formula for Formulation of face serum
|
S. No |
Excipients |
Amount |
|
1 |
Manjistha loaded ethosomal suspension |
10 ml |
|
2 |
Glycerin |
1.5ml |
|
3 |
Cholestrol |
0.06g |
|
4 |
Xanthan gum |
0.09g |
|
5 |
Triethanolamine |
q.s. (pH 5.5-6.5) 0.003ml |
|
6 |
Tween 20 |
1.5 ml |
|
7 |
Rose oil |
0.3ml |
|
8 |
Water |
q.s.to 30ml |
3.2.2. Cold Process Method
The Manjistha-loaded ethosomal face serum was prepared by the cold process method. Xanthan gum (0.09 g) was hydrated in 10 mL distilled water for 30 minutes with continuous stirring. Glycerin, sodium benzoate, Tween 20, and rose or lavender oil were then added and mixed gently. About 10 mL of the ethosomal suspension was incorporated slowly into the gel base to maintain vesicle integrity. The pH was adjusted to 5.5–6.5 using triethanolamine, and distilled water was added to make the volume 30 mL. The serum was mixed until uniform, filled into an amber glass bottle, and stored in a cool place. [49]
4. Evaluation
4.1. Evaluation of Ethosomes: [50]
4.1.1. Morphology
Transmission Electron Microscopy, SEM:
The morphology of Manjistha extract-loaded ethosomes was evaluated using electron microscopy. The prepared ethosomes appeared predominantly spherical to nearly spherical, with smooth surfaces, well-defined boundaries, and minimal aggregation. These morphological characteristics confirmed the successful formation and stability of the ethosomal vesicles.
4.1.2. Appearance:
The prepared Manjistha extract-loaded ethosomal suspension was visually evaluated for color, homogeneity, clarity, consistency, phase separation, precipitation, and aggregation. The formulation appeared as a homogeneous, light reddish-brown colloidal dispersion with smooth consistency. No phase separation, precipitation, sedimentation, or visible aggregation was observed, indicating successful formation and good physical stability of the ethosomal system.
4.1.3. Particle Size:
The particle size of Manjistha extract-loaded ethosomes was determined by Dynamic Light Scattering (DLS) using a Zetasizer. The suspension was diluted 1:100 with filtered distilled water, gently mixed, and transferred into a bubble-free cuvette. Measurements were performed at 25 ± 2°C with a 173° backscattering angle. Each sample was analyzed in triplicate, and the mean particle size and polydispersity index (PDI) were recorded based on Brownian motion and calculated using the Stokes–Einstein equation.
Stokes–Einstein Equation
d = k
𝟑𝛑𝛈𝐃
Where:
4.1.4. pH:
The pH of the prepared Manjistha extract-loaded ethosomal suspension was determined using a calibrated digital pH meter. Before measurement, the pH meter was calibrated using standard buffer solutions of pH 4.0, 7.0, and 9.2 to ensure accuracy. Approximately 1 mL of the ethosomal suspension was diluted with 10 mL of distilled water and mixed gently to obtain a uniform dispersion. The electrode was rinsed with distilled water, blotted dry with tissue paper, and immersed in the sample. The pH was recorded after a stable reading was obtained. All measurements were carried out at room temperature (25 ± 2°C) in triplicate, and the mean pH value ± standard deviation was calculated and reported. For topical ethosomal formulations, a pH range of 5.0–7.0 is considered suitable to maintain skin compatibility and minimize irritation.
4.1.5. Zeta Potential:
The zeta potential of the Manjistha extract-loaded ethosomal suspension was determined using a Zetasizer by Electrophoretic Light Scattering (ELS). The suspension was diluted 1:100 with filtered distilled water and transferred into a bubble-free folded capillary cell. Measurements were performed at 25 ± 2°C after entering the required dispersion parameters into the instrument software. The electrophoretic mobility of the vesicles was measured, and zeta potential was calculated using the Henry equation. Measurements were carried out in triplicate, and the mean zeta potential ± standard deviation was recorded. A value of ±30 mV or higher generally indicates good physical stability.
Henry Equation:
Ζ=2ηUe
3εf(Ka)
Where:
4.1.6. Drug Entrapment Efficiency:
The entrapment efficiency (EE%) of the Manjistha extract-loaded ethosomal suspension was determined by centrifugation. About 1 mL of the suspension was centrifuged at 15,000 rpm for 30 minutes at 4°C to separate free drug from the vesicles. The supernatant was collected, suitably diluted, and analyzed by UV–Visible spectrophotometry at the λmax of the extract. The analysis was performed in triplicate, and the mean EE% ± standard deviation was calculated
Entrapment Efficiency (%) = Total drug - Free Drug
Total Drug x 100
Where:
4.1.7. Drug Content:
The drug content of the Manjistha extract-loaded ethosomal suspension was determined using a UV–Visible spectrophotometer. About 1 mL of the suspension was accurately measured, diluted with a suitable solvent, and analyzed at the λmax of the extract against a blank. The drug concentration was calculated using the previously prepared calibration curve. Measurements were performed in triplicate, and the mean drug content ± standard deviation was recorded.
Drug Content (%) = particle Drug Content
Theoretical Drug Content x100
Where:
4.1. Evaluation of Face Serum [51]
Physical Examination
4.1.1. Appearance:
The prepared Manjistha extract-loaded ethosomal face serum was visually evaluated under normal daylight for color, clarity, homogeneity, consistency, phase separation, and visible particles. The formulation was expected to exhibit a smooth and uniform appearance without precipitation or phase separation, indicating good physical stability.
4.1.2. pH:
The pH of the prepared Manjistha extract-loaded ethosomal face serum was determined using a calibrated digital pH meter. Approximately 1 g of the serum was dispersed in 10 mL of distilled water, and the pH was measured after the electrode reading became stable. The determination was performed in triplicate at 25 ± 2°C, and the average value was recorded.
4.1.3. Spread ability:
The spread ability of the prepared face serum was determined using the glass slide method. Approximately 0.5 g of the formulation was placed between two glass slides. A known weightwas placed on the upper slide, and the time taken for the upper slide to move a fixed distance was recorded. The spread ability was calculated using the following equation:
Formula
S = (M × L) / T
4.1.4. Viscosity:
The viscosity of the Manjistha extract-loaded ethosomal face serum was determined using a Brookfield Digital Viscometer with a suitable spindle at 25 ± 2°C. About 50 mL of serum was transferred into a clean beaker, ensuring the absence of air bubbles. The spindle was immersed without touching the container, and viscosity was measured at a suitable speed of 20–50 rpm. The reading was recorded after stabilization. Measurements were performed in triplicate, and the mean viscosity ± standard deviation was expressed in mPa·s or cP.
4.1.5. Homogeneity:
The homogeneity of the Manjistha extract-loaded ethosomal face serum was evaluated by visual inspection. A small amount of serum was placed on a clean glass slide and examined for uniformity, smoothness, consistency, lumps, coarse particles, and phase separation. The serum was also rubbed gently between the fingers to assess its texture and grittiness. The evaluation was performed in triplicate. A smooth, uniform, and particle-free formulation without phase separation indicated good homogeneity and physical stability.
4.1.6. In Vitro Drug Release Study:
The in vitro drug release of Manjistha extract-loaded ethosomal face serum was evaluated using a Franz diffusion cell with a hydrated dialysis membrane (MWCO 12,000–14,000 Da). The receptor compartment contained phosphate buffer (pH 7.4) and was maintained at 37 ± 0.5°C with stirring at 300 rpm. About 1 g of serum was placed in the donor compartment, and 1 mL samples were withdrawn at 0.5, 1, 2, 4, 6, 8, and 12 hours, replacing each with fresh buffer. Samples were analyzed by UV–Visible spectrophotometry at the λmax of Manjistha extract, and cumulative drug release was calculated. The study was performed in triplicate, and mean cumulative drug release ± standard deviation was reported.
4.1.7. Drug Release Kinetics:
The drug release kinetics of Manjistha extract-loaded ethosomal face serum were evaluated by fitting the in vitro release data to Zero-order, First-order, Higuchi, Hixson–Crowell, and Korsmeyer–Peppas models. The model with the highest correlation coefficient (R²) was considered the best fit. These models helped determine whether drug release followed a constant-rate, concentration-dependent, diffusion-controlled, surface-area-dependent, or anomalous transport mechanism. The kinetic analysis provided information on the release behavior and mechanism of the formulated face serum.
5.RESULT AND DISCUSSION:
5.1. PREFORMULATION STUDIES:
5.1.1. Absorption maximum:
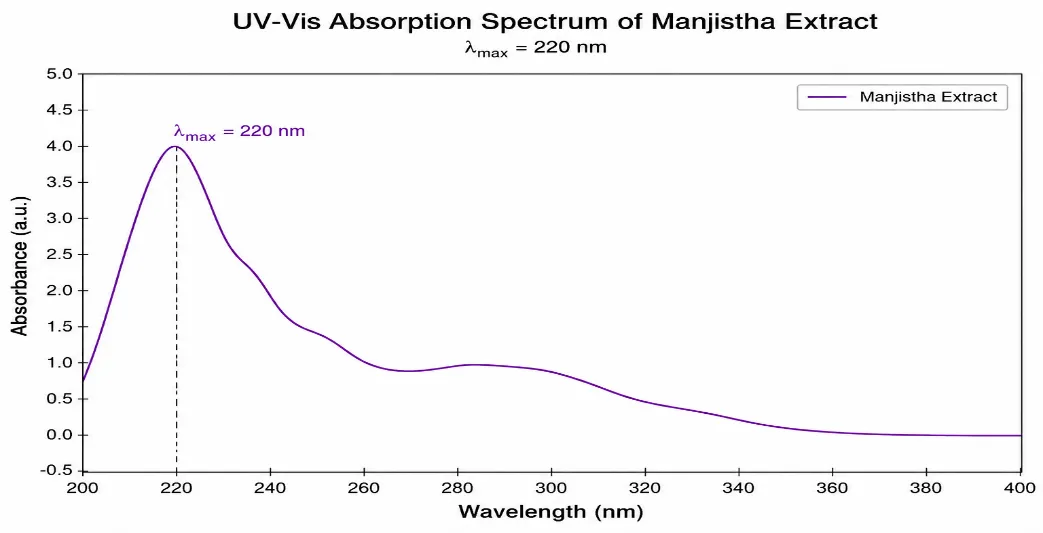
Fig:1 UV Spectrum of Manjistha
The UV spectrum showed broad absorbance from 200–400 nm. The formulation exhibited higher absorbance around 220 nm compared with the Manjistha extract, confirming successful incorporation of the active component.
5.1.2. Calibration curve:
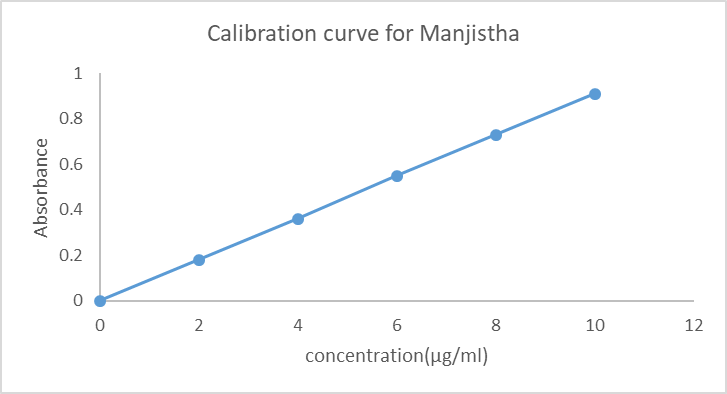
Fig:2 Calibration Curve for Manjistha
The calibration curve of Manjistha showed a linear increase in absorbance at 220 nm with increasing concentration from 0–10 µg/mL, following Beer–Lambert’s law. The good linearity indicated reliable and reproducible absorbance values, confirming the suitability of the UV–Visible spectrophotometric method for quantitative estimation of Manjistha.
5.2 Evaluation of Ethosomes:
5.2.1. Appearance:
The prepared Manjistha extract-loaded ethosomal face serum (F3) was found to be clear, homogeneous, smooth, and free-flowing, with a light reddish-brown colour. No particulate matter, phase separation, precipitation, or crystal formation was observed. The formulation showed a non-greasy, non-sticky texture and spread uniformly on the skin, indicating satisfactory physical characteristics and homogeneous incorporation of Manjistha-loaded ethosomes into the serum base.
5.2.2. Determination of particle size
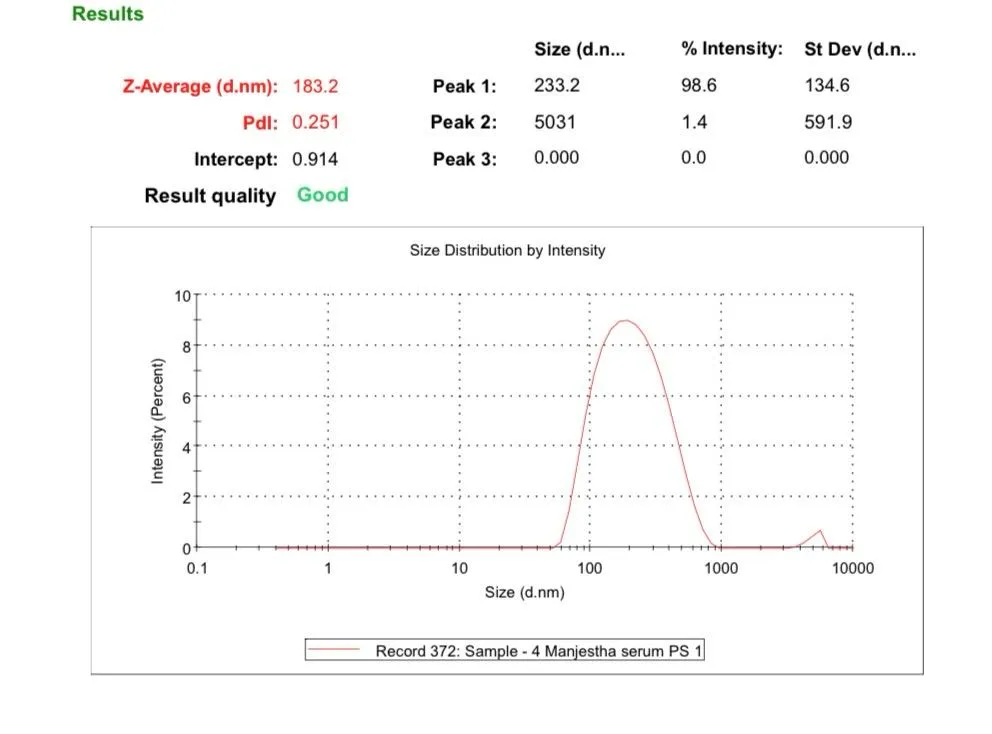
Fig:3 Particle size optimized Manjistha extract loaded ethosomal formulation (ME1)
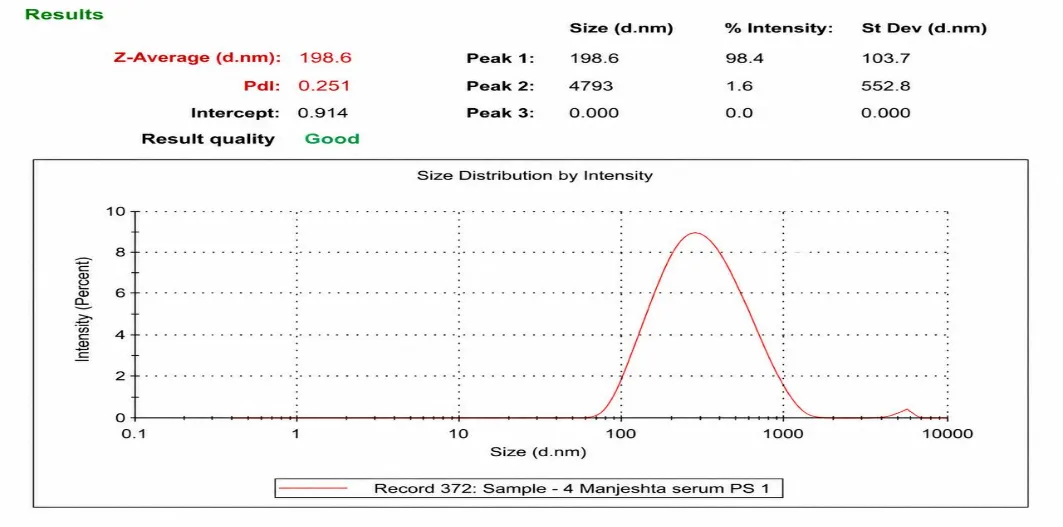
Fig:4 Particle size optimized Manjistha extract loaded ethosomal formulation (ME2)
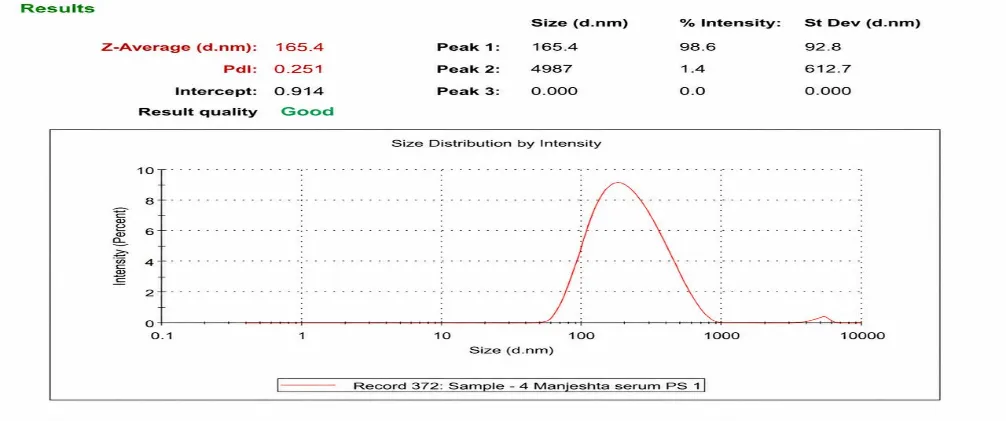
Fig:5 Particle size optimized Manjistha extract loaded ethosomal formulation (ME3)
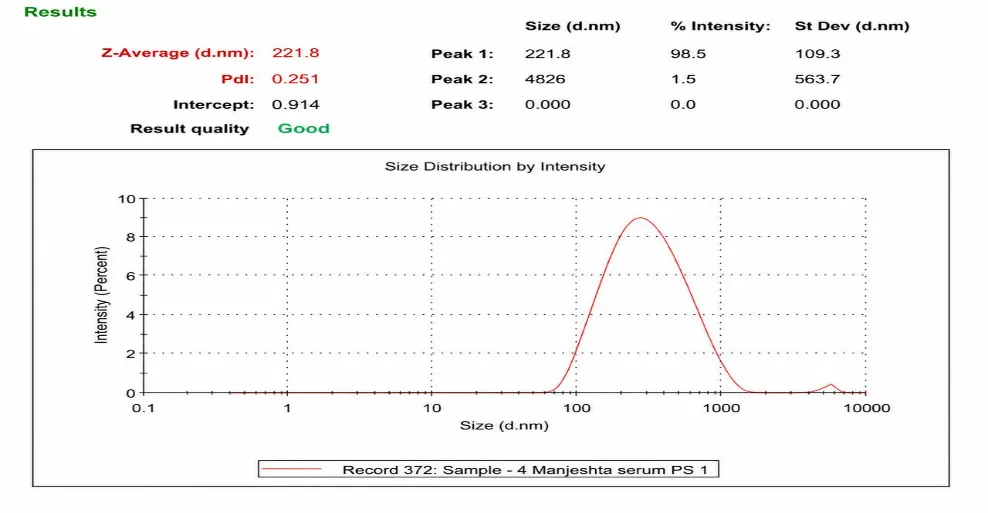
Fig:6 Particle size optimized Manjistha extract loaded ethosomal formulation (ME4)
The optimized Manjistha ethosomal formulation (F3) showed a particle size of 165.5 nm and a PDI of 0.248, indicating nanosized vesicles with a relatively uniform size distribution. These characteristics suggest good formulation uniformity and suitability for topical delivery.
8.2.3. Determination of zeta potential
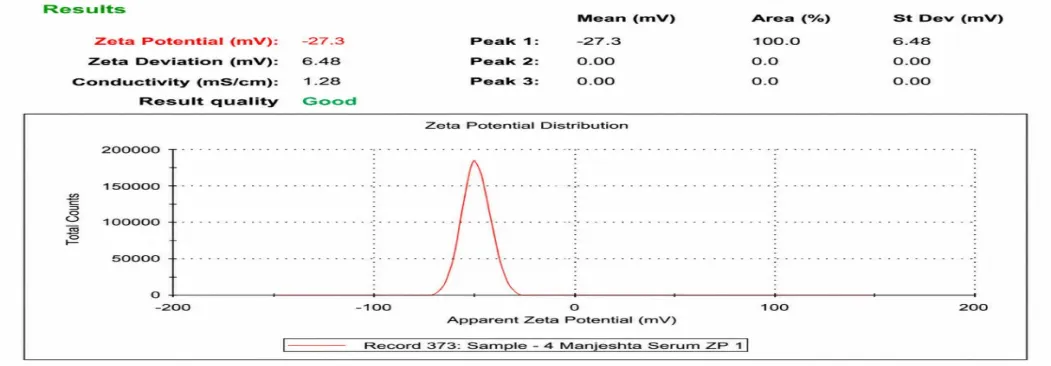
Fig: 7 Zeta potential optimised Manjistha extract loaded ethosomal formulation (ME1)
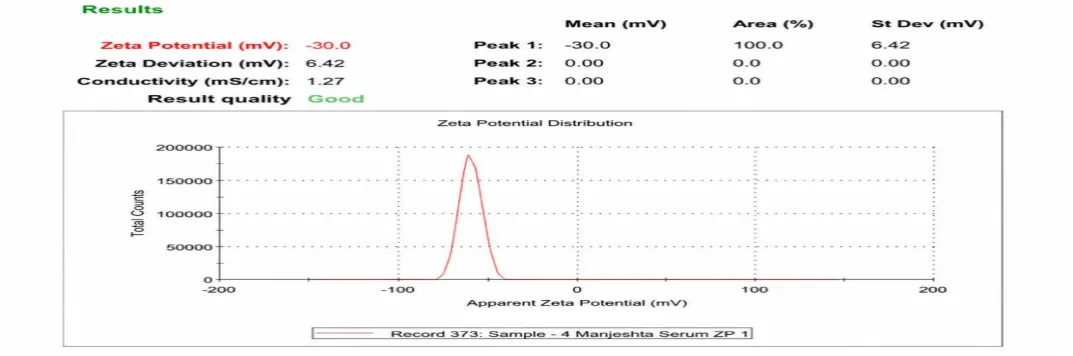
Fig: 8 Zeta potential optimised Manjistha extract loaded ethosomal formulation (ME2)
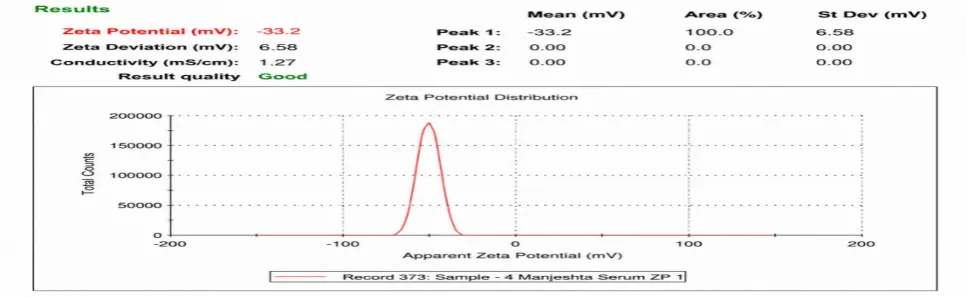
Fig: 9 Zeta potential optimised Manjistha extract loaded ethosomal formulation (ME3)
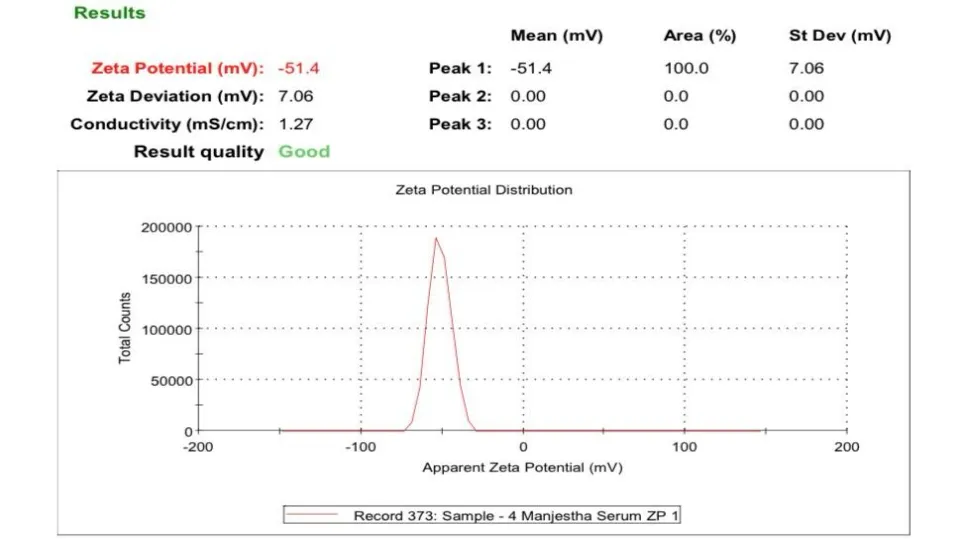
Fig: 10 Zeta potential optimised Manjistha extract loaded ethosomal formulation (ME4)
The optimized Manjistha ethosomal formulation (ME3) showed a zeta potential of −33.2 mV, indicating good colloidal stability. The negative surface charge provides sufficient repulsion between vesicles, reducing aggregation and maintaining a uniform dispersion. Thus, ME3 demonstrated good physical stability and suitability for topical delivery.
5.2.4. In vitro drug release studies
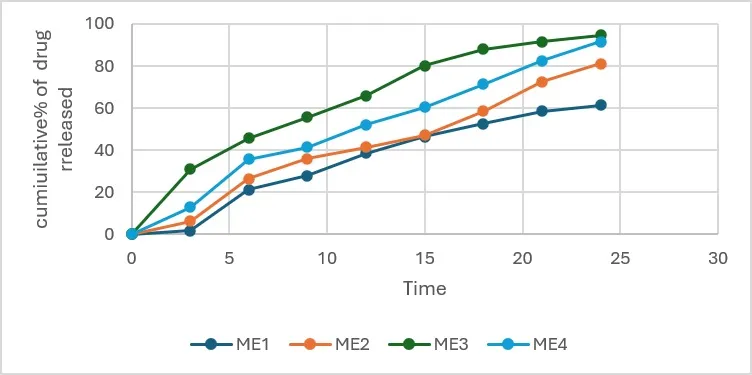
Fig:11in vitro drug release profile for manjistha extract loaded ethosomal formulation
5.2.5. In vitro drug release kinetics
5.2.5.1. Zero-order kinetics model for Manjistha Extract Loaded Ethosomal formulation
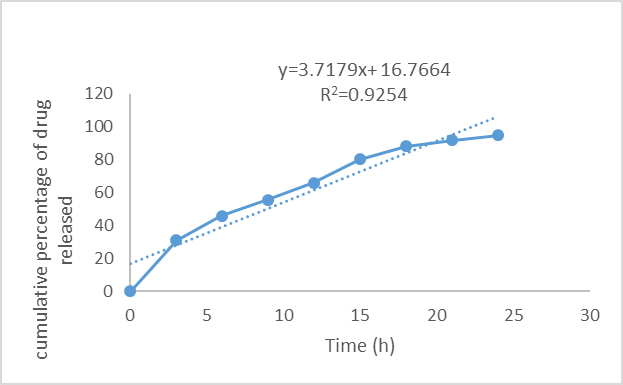
Figure: 12 Zero-order kinetics model for Manjistha Extract Loaded Ethosomal formulation
5.2.5.2. First-order kinetics model for Manjistha Extract Loaded Ethosomal formulation
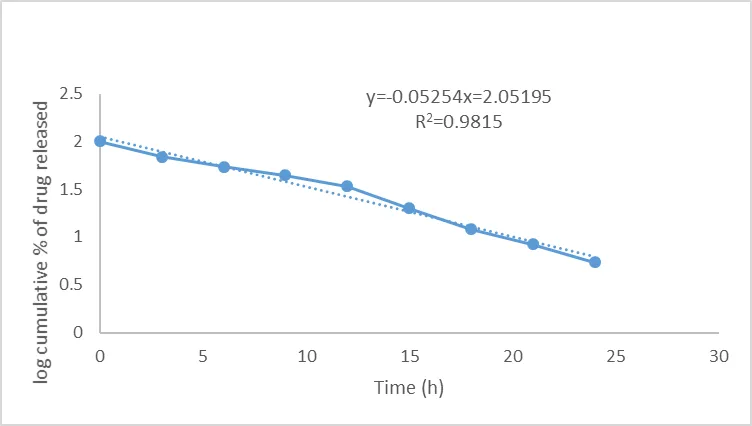
Figure: 13 First-order kinetics model for Manjistha Extract Loaded Ethosomal formulation
5.2.5.3. Kors Meyer Peppas' kinetic model for Manjistha Extract Loaded Ethosomal formulation.
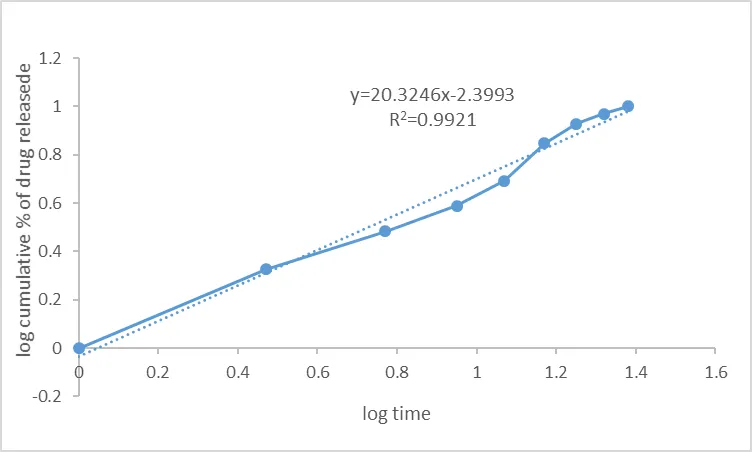
Figure: 14 Kors Meyer Peppas' kinetic model for Manjistha Extract Loaded Ethosomal Face Serum.
5.2.5.4. Higuchi model for Manjistha Extract Loaded Ethosomal formulation
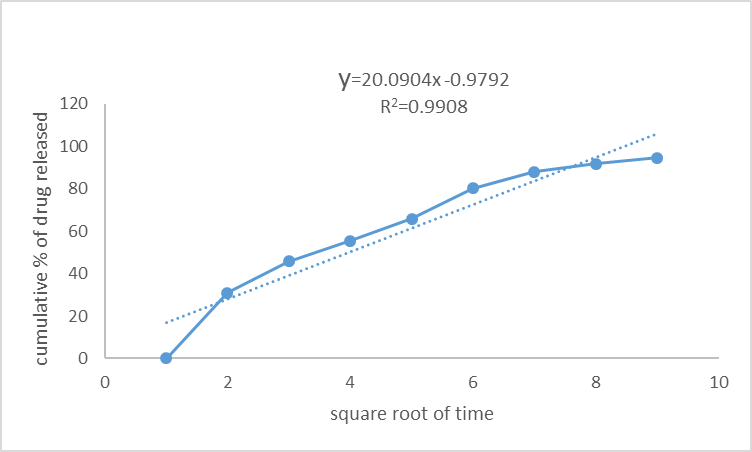
Fig: 15 Higuchi model for Manjistha Extract Loaded Ethosomal Face Serum
The optimized Manjistha ethosomal formulation showed the best fit with the Korsmeyer–Peppas model (R² = 0.9921), followed by the Higuchi model (R² = 0.9908). The release exponent (n = 0.70) indicated non-Fickian diffusion, suggesting that drug release occurs through a combination of diffusion and polymer relaxation or erosion. These findings confirm controlled and sustained drug release from the formulation.
5.3. Evaluation of Serum
5.3.1. Physical evaluation
The prepared Manjistha extract-loaded ethosomal face serum was evaluated for its physical appearance. The serum was smooth, homogeneous, and free from lumps or visible particles. It had a light reddish-brown colour with a pleasant characteristic Odor.
5.3.2. pH
Table: 3 Ph value for face serum
|
Formulation |
pH |
|
MEFS1 |
5.98 |
|
MEFS2 |
6.12 |
|
MEFS3 |
5.82 |
|
MEFS4 |
6.05 |
The pH of the four Manjistha ethosomal face serum formulations ranged from 5.82–6.12, suitable for topical application. MEF3 showed the lowest pH (5.82), closest to the natural skin pH, indicating better skin compatibility and reduced irritation potential. Therefore, MEF3 was considered optimal based on pH.
5.3.3. Viscosity
Table: 4 Viscosity value for face serum
|
Formulation |
Viscosity |
|
MEFS1 |
52.4mpa.s3420mpa.s |
|
MEFS2 |
63.8mpa.s |
|
MEFS3 |
71.7mpa.s |
|
MEFS4 |
82.5mpa.s |
The viscosity of the four Manjistha ethosomal face serum formulations ranged from 52.4 ± 1.8 to 83.5 ± 1.6 mPa·s, indicating good consistency and uniformity. MEFS4 showed the highest viscosity, while MEFS1 showed the lowest. The observed variation indicated good homogeneity and stability among the formulations.
5.3.4. spreadability
Table :5 Spreadability value for face serum
|
Formulation |
Value |
|
MEFS1 |
6.8 |
|
MEFS2 |
8.2 |
|
MEFS3 |
10.5 |
|
MEFS4 |
9.1 |
The spreadability of the four Manjistha ethosomal face serum formulations ranged from 6.8–10.5 g·cm/s, indicating satisfactory spreading properties. MEF3 showed the highest spreadability (10.5 g·cm/s), suggesting easier and more uniform application on the skin. Therefore, MEF3 was considered optimal based on spreadability.
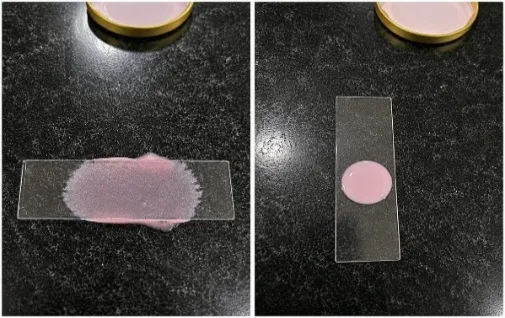
Fig:16 Spreadability result for MEFS1, MEFS2 and MMEFS3, MEFS.
5.3.5 In vitro drug release
The optimized Manjistha ethosomal face serum (F3) showed sustained drug release, with about 28–35% release at 3 hours, 65–75% at 12 hours, and 90–95% at 24 hours. This controlled release pattern indicates prolonged delivery of Manjistha phytoconstituents and supports its potential for sustained topical activity.
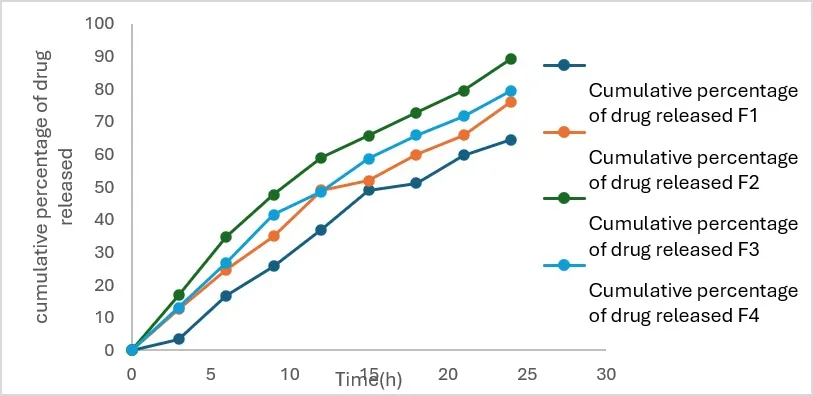
Fig: 17 in vitro drug release profile for manjistha extract loaded ethosomal face serum formulation
5.3.6. In vitro drug release kinetics
5.3.6.1 Zero-order kinetics model for Manjistha Extract Loaded Ethosomal Face Serum
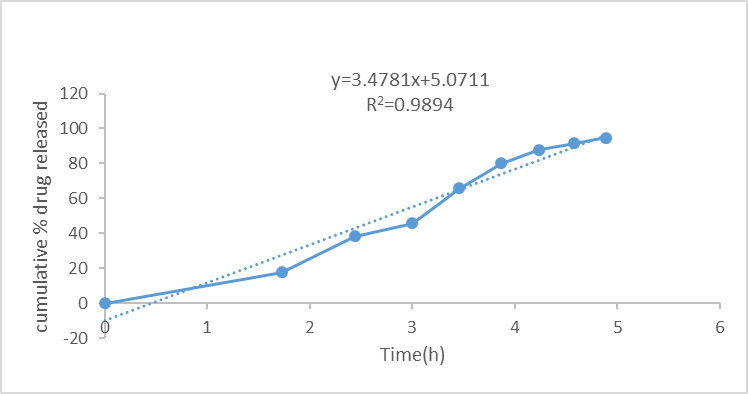
Figure: 18: Zero-order kinetics model for Manjistha Extract Loaded Ethosomal Face Serum.
5.3.6.2. First-order kinetics model for Manjistha Extract Loaded Ethosomal Face Serum
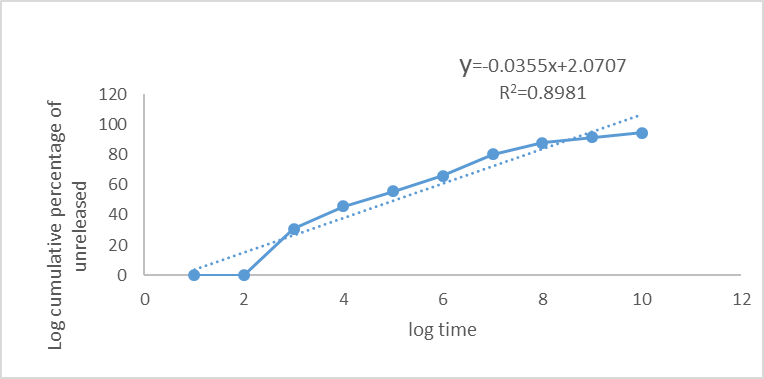
Figure: 19 First-order kinetics model for Manjistha Extract Loaded Ethosomal Face Serum
5.3.6.3. Kors Meyer Peppas' kinetic model for Manjistha Extract Loaded Ethosomal Face Serum
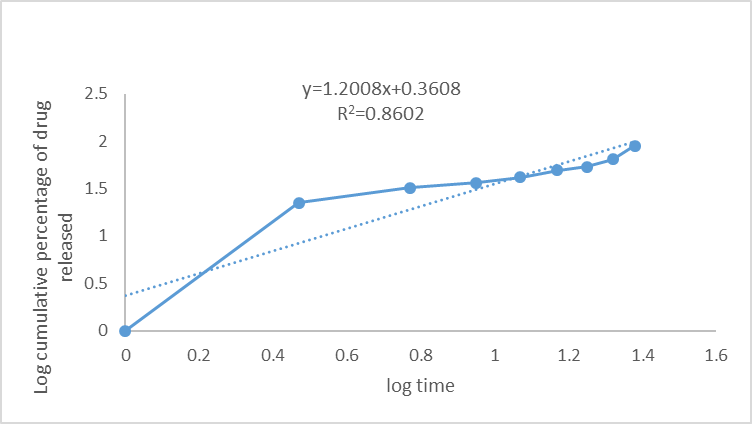
Figure: 20 Kors Meyer Peppas' kinetic model for Manjistha Extract Loaded Ethosomal Face Serum.
5.36.4. Higuchi model for Manjistha Extract Loaded Ethosomal Face Serum
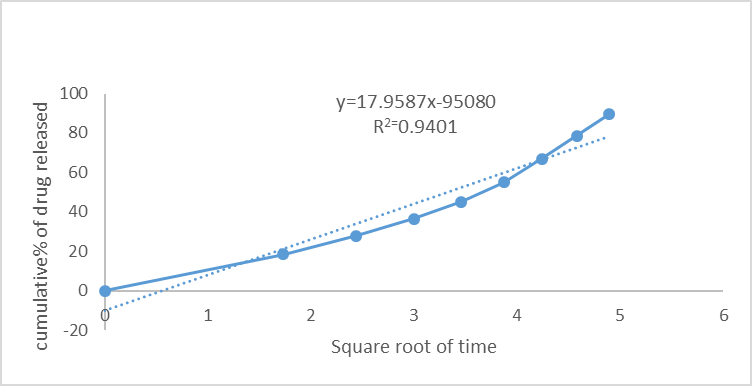
Fig: 21 Higuchi model for Manjistha Extract Loaded Ethosomal Face Serum
The optimized Manjistha ethosomal formulation showed the best fit with the zero-order model (R² = 0.9894), indicating a relatively constant drug release rate. The Higuchi model showed R² = 0.9401, while the first-order and Korsmeyer–Peppas models showed lower fits. The Korsmeyer–Peppas n-value of 1.20 indicated super case-II transport. Overall, the formulation demonstrated controlled and sustained drug release.
SUMMARY & CONCVLUSION:
The present study aimed to formulate and evaluate Manjistha (Rubia cordifolia) extract-loaded ethosomal face serum for enhanced dermal delivery. The optimized ethosomal formulation ME3 showed a particle size of 165.4 nm, PDI of 0.248, and zeta potential of −33.2 mV, indicating good stability and uniformity. SEM revealed smooth, spherical vesicles with minimal aggregation, while in-vitro release reached 94.55% at 24 h. The formulated face serum exhibited satisfactory properties, including a pH of 5.82, viscosity of 71.7 mPa·s, spreadability of 10.5, and drug content of 96.14 ± 0.92%. It showed 89.4% drug release with predominantly zero-order kinetics, indicating controlled and sustained release. Overall, the formulation demonstrated good physicochemical properties, stability, and potential for prolonged topical delivery of Manjistha phytoconstituents. Further skin permeation, stability, and in-vivo studies are recommended.
REFERENCES


Christopher Vimalson D.*, Alagarraja M. Naveen V., Sunilrajan K., Sinthan S., Joseph Ajay J., Fathima Lana C., Nihala Cp., Nivetha Ps., Risal Ku., Formulation and Evaluation of Manjistha Extract Loaded Ethosomal Face Serum for Enhanced Dermal Delivery, Int. J. Med. Pharm. Sci., 2026, 2 (9), 260-275. https://doi.org/10.5281/zenodo.22669810
 10.5281/zenodo.22669810