

We use cookies to ensure our website works properly and to personalise your experience. Cookies policy
Faculty of Pharmacy, Mansarovar Global University, Sehore (M.P)
In Present Research highly resistant and aggressive nature of melanoma in mind, dacarbazine and eugenol loaded liposomes were successfully developed for a combinatorial approach against melanoma. The QbD approach enabled us to synthesize the said anti-melanoma formulation with optimum parameters in the most logical manner. Applying this QbD approach at two levels further made the process easier to reproduce, and more cost- effective. Surface functionalization of the formulation made the entire therapy more targeted to spare normal body cells from unwanted toxicity. In-vitro characterization of the nanoliposomes ascertained the utility of the QbD application The performance of the formulation as an anti- melanoma agent was assessed by cell line studies. Combining eugenol with dacarbazine resulted in much higher anti-melanoma activity of the formulation. This enhancement is supposed to be due to the inhibition of the anti- apoptotic protein survivin, which is overexpressed in the melanoma cells, and makes them resistant towards apoptosis. Including Eugenol has supposedly resulted in downregulation of survivin protein, consequent to which, dacarbazine could perform its function to its maximum potential. In addition to increased apoptosis and cytotoxicity, this combination also promises to inhibit the metastatic potential of the melanoma. Further, HA coating was found to enhance the uptake of the liposomes in B16F10 cells and reduce the phagocytic engulfment by macrophages. Pharmacodynamics study showed significant difference in the tumor volumes after 10 days of the treatment with DELC and Dacarbazine Solution (DS). In lungs, metastasis could be seen in the control and dacarbazine solution group, but not in DELC group. Liver toxicity was also not observed in the DELC group, while hemorrhage was seen in DS group. DELC was also found to be safe for blood cells and thus suitable for i.v. administration. Conclusively, combining eugenol with the dacarbazine results in better therapeutic outcomes in the treatment of melanoma and thus can be a hope against this resistant,aggressive and deadly cancer. Thus, the combination of dacarbazine and eugenol holds the promise of overcoming the resistance of melanoma cells and challenges of anti-melanoma therapies.
Cancer
Cancer is a broad term given to a group of diseases all involving unregulated growth of cells. Cancer originates in a normal cycle of cell division when a cell can turn cancerous and divide infinitely. Lymphatic system and bloodstream can also spread the cancer to distant parts of the body. Two types of genes are affected: Oncogenes and Tumor suppressor genes. Oncogenes are those genes that stimulate reproduction and growth of the cells. Tumor suppressor genes are those genes that obstruct the survival and division of the cells. Tumor formation can take place due to the inappropriate over-expression of normal oncogenes, formation of novel oncogenes, or because of under-expression or deactivating of tumor suppressor genes (figure 1.1). Characteristically, many genes are required to be altered in order to convert a normal cell into a cancerous one (1). With over 10 million new cases per year worldwide, cancer remains a difficult disease to treat and a significant cause for morbidity and mortality. Conventional anti-cancer therapies come with a number of drawbacks and side effects. Conventional therapy for cancer includes treatment with cytotoxic drugs (eg. doxorubicin, paclitaxel etc), radiation therapy and surgical removal of tumors. Cytotoxic drugs cause severe side effects because the mechanisms which they inhibit are common to both cancer cells and normal cells, such as ligation – relegation reaction during cell division. Thus tumor cells and normal cells both are killed by anti-cancer drugs. Bone marrow, gastrointestinal mucosa, hair follicles and gonads are among the tissues most sensitive to chemotherapy. Chemotherapeutic agents are also highly teratogenic (2). Development of resistance is another major drawback of chemotherapy. Higher doses are required to kill resistant tumor cells which further worsen the problem of unwanted side effects. Radiation therapy is successful only when tumor is localized and well defined. For surgical removal also, the tumour must be well confined. Surgery is also often not possible when the tumour is bounded by delicate and complex tissues, like brain. The top 5 most common cancers are lung, breast, colorectal, prostate and stomach with 12.3%, 12.3%, 10.6%, 7.5% and 6.1% incidences of all cancer cases
Melanoma
Melanin is the pigment which imparts color to skin and hair, and protects skin from the damage of ultraviolet radiations. Melanocytes are the specialized cells that are known to produce melanin. The cancerous growth of melanocytes is termed as Melanoma (3). Skin cancer, including malignant melanoma and non- melanoma skin cancer, is the most common cancer in Caucasian population (4). Melanoma is the most aggressive and deadly type of skin cancer. Though it accounts for only 4% of all skin cancers, but it causes the highest number of skin cancer- related deaths worldwide. The increase in incidence of Primary Cutaneous Melanoma in Caucasian populations has been constantly rising and is reported to double up every 10– 14 years (5). The highest increase is reported in men above the age of 55 years and women of all age groups (6). The estimated number of new cases of melanoma in 2017 is 87,110, which accounts for 5.2% of all new cancer cases. Estimated deaths in 2017 are 9,730. This number of melanoma cases is perhaps even higher than mentioned as the National Cancer Registries has reported that the incidences are underestimated in few countries (7). Moreover, after lung cancer and breast cancer, melanoma is the third most common reason of brain metastases. Melanoma spreads to the brain in upto 75 % of melanoma patients. Brain metastases cause death in 95 % of the cases (8). Till date, only four drugs have been approved for the treatment of melanoma, which are, dacarbazine, interleukin-2, ipilimumab and vemurafenib. Continuous efforts have been made to develop new drugs and new treatment strategies, but not many of them have given much hope. Dacarbazine was the first drug which was approved for melanoma treatment in 1975, and it still remains the gold standard chemotherapeutic drug against melanoma; although ipilimumab and vemurafenib have shown promising results in last few years. Recent experiments and results present the combinatorial approach as a promising one for treatment of aggressive melanomas, and so combining dacarbazine or other chemotherapeutic drugs with new agents seems to hold the potential that scientists have been looking for since decades (9). Though the better understanding of pathophysiology of melanoma has led to the development of new drugs which target specific pathways such as MAPK (mitogen- activated protein kinase) pathway, there success is limited due to the resistance of melanoma cells and higher toxicities of these drugs (10).
Prevalence and Epidemiology
The occurrence of melanoma has been growing among all age groups; more than 600% increase is reported in young adults between 1970 and 2009. In United States of America, melanoma is reportedly the sixth most common cancer in men and women, and the second most common cancer in women having age between 20 and 29 years At current rates, 1 in 27 white men and 1 in 42 white women are expected to develop invasive melanoma in their lifetime. In United Kingdom (UK) also, the number of incidences are on rise. Also, it is found to be most prevalent in age group 65-69 years Most melanomas arise in previously normal skin, and only 20% to 30% arise from pre- existing nevi. Although there are several genetic syndromes that predispose individuals to melanoma, these account for less than 15% of melanomas. These syndromes include xeroderma pigmentosa and familial atypical mole-melanoma syndrome (called dysplastic nevus syndrome. In the evidence of epidemiologic studies, it is shown that solar radiation exposure is the main cause of cutaneous melanoma (11). This relationship is further sustained by anatomical differences in gender, race, latitude of residence, and migration. In men, the most common site of melanoma occurence is upper back; in women, the most common sites include upper back and lower parts of legs. According to studies, people who have migrated to countries having more of ambient solar radiations have higher risk of developing melanoma than people who did not migrate. Similarly, melanoma frequency and mortality rate in whites are inversely related to distance from the equator. Differences in race are also found to exist. The lesser incidences of melanoma in highly pigmented people is a result of the protective function of melanin and smaller number of nevi (12).
Causes and Risk Factors
The core risk factors of melanoma are phenotype (blue eyes, fair complexion, and blond or red hair), cutaneous response towards exposure to sun (freckling, tanning inability, sunburn sensitivity), blistering sunburn history, strong recurrent sun exposure, genetic susceptibility, subtypes and amount of nevi (atypical nevi or giant melanocytic nevi), immunosuppression and history of melanoma. According to genetic investigations, 50% of familial melanomas and 25% of sporadic melanomas may be a result of mutations in the tumor suppressor protein p16. Chromosome 9p21 has been identified as the familial melanoma gene in linkage studies. Familial melanoma accounts for 8% to 12% of all melanoma cases. The inheritance mode is supposed to be polygenic. The cumulative risk of developing cutaneous melanoma in persons with a history of familial melanoma is estimated to be 50% by age 50.
MATERIAL & METHODS
Preparation of Phosphate Buffer Saline (PBS) pH 7.4 (IP 2010)
2.38 gm of disodium hydrogen phosphate, 0.19 gm of potassium dihydrogen phosphate and 8.0 gm of sodium chloride were dissolved in sufficient water and the volume was made up to 1000 ml with water.
Dialysis Membrane Activation
Glycerine was removed by washing in running water for 3 hours. To remove Sulphur compounds, membrane was treated with 0.3% w/v solution of sodium sulfide at 80°C for one minute. Then it was washed with hot water (60°C) for 2 minutes followed by acidification with 0.2% (v/v) sulfuric acid, and rinsed with hot water to remove the acid.
Dacarbazine
Qualitative Analysis Physical Properties
Dacarbazine was inspected visually to check the color, appearance and physical characteristics.
UV spectral analysis
Accurately weighed quantity (10 mg) of Dacarbazine was dissolved in water in the volumetric flask and volume was made up to 100 ml to achieve the concentration of 100 µg/ml. 0.5 ml of above solution was diluted to 10 ml with water in 10 ml volumetric flask (5 µg/ml). The resulting solution was then scanned for UV-Vis absorption using UV-Vis spectrophotometer in the range of 200-400 nm and λmax was determined.
Melting Point Determination
Fine powder of Dacarbazine was filled in a clean and dry capillary of uniform diameter across the length by tapping it slowly over powder bed till whole length was packed with compact column 4-6 mm high. The capillary tube was then inserted into melting point apparatus along with thermometer. The temperature at which the drug transitioned into the liquid state was recorded.
Quantitative Analysis By UV
Sample of Dacarbazine was scanned for the absorption spectrum in the region of 200- 400 nm in different solvents and the maximum wavelength was determined in respective solvents. Calibration curves were drawn.
In distilled water
Stock solution having concentration 100µg/ml was prepared by dissolving 10 mg Dacarbazine in 100ml distilled water. Stock solution was then further diluted to get the solutions of 1, 2, 3, 4, 5, 6, 7, 8, 9, 10 µg/ml. The solutions were scanned to determine λmax using distilled water as blank. Different sample concentrations were analyzed by UV spectrophotometer at λmax and the absorbance was noted. Readings were taken in triplicates to ensure precision and accuracy. Calibration curve was drawn using MS-Excel 2010.
In PBS pH 7.4
Stock solution having concentration 100µg/ml was prepared by dissolving 10 mg Dacarbazine in 100ml PBS (pH 7.4). Stock solution was then further diluted to get the solutions of 1, 2, 3, 4, 5, 6, 7, 8, 9, 10 µg/ml. The solutions were scanned to determine λmax using PBS (pH 7.4) as blank. Different sample concentrations were analyzed by UV spectrophotometer at λmax and the absorbance was noted. Readings were taken in triplicates to ensure precision and accuracy. Calibration curve was drawn using MS-Excel 2010.
In PBS 7.4: Propylene glycol (9:1)
100 µg/ml stock solution of Dacarbazine was prepared in mixture of PBS 7.4 and propylene glycol (9:1). Stock solution was suitably diluted to get concentrations of 1, 2, 3, 4, 5, 6, 7, 8, 9, and 10 µg/ml. The solutions were scanned to determine λmax using blank as mixture of PBS 7.4 and propylene glycol (9:1). Different sample concentrations were analyzed by UV spectrophotometer at λmax 333 nm and the absorbance was noted. Using MS- Excel, calibration curve is drawn. Process was repeated for 3 times for precision and accuracy.
In Ethanol
100 µg/ml Stock solution of drug was prepared in Ethanol. Stock solution was diluted to get the sample solution of 1, 2, 3, 4, 5, 6, 7, 8, 9, and 10 µg/ml. The solutions were scanned to determine λmax using blank as Ethanol. Different sample concentrations were analyzed by UV spectrophotometer at λmax 333 nm and the absorbance was noted. Using MS- Excel, calibration curve is drawn. Process was repeated for 3 times for precision and accuracy.
Solubility Analysis
Solubility of Dacarbazine was determined in water, phosphate buffer saline pH 7.4 and ethanol. Excess amount of the drug was added to 2 ml of water in eppendorf tube and protected from sunlight. The sealed vials were then placed in incubator shaker. The temperature was adjusted to 37°C. The sample was filtered after 48 hours and was analyzed by UV spectrophotometer. Concentration of drug was determined from the calibration curve.
Partition Coefficient
Partition coefficient of drug was calculated in Octanol and water. 50 ml each of the above-mentioned solvents were taken together into a separating funnel. 10 mg of drug was then added and the funnel was shaken at regular time intervals. After 24 hours, aliquots were withdrawn from aqueous phase, diluted appropriately and absorbance was determined. Concentration present in the aqueous phase was determined using calibration curve.
Partition coefficient is determined by: Log Po/w = Log (Coil/ Caq) at equilibrium Where, Coil is the amount of the drug present in octanol (Total Amount - Caq) Caq is the amount of the drug present in water
Eugenol
Qualitative Analysis of The Drug Sample Physical Properties
Eugenol Sample was inspected visually to check the color appearance odor and physical characteristics.
UV spectral analysis
Accurately weighed quantity (100 mg) of Eugenol was dissolved in ethanol in the volumetric flask and volume was made up to 100ml (1000 µg/ml). 0.5 ml of above solution was diluted to 10 ml with ethanol in 10 ml volumetric flask (50 µg/ml). The resulting solution was then scanned for UV-Vis absorption using UV-Vis spectrophotometer in the range of 200-400 nm and λmax was determined.
Quantitative Analysis By UV
Sample of Eugenol was scanned for the absorption spectrum in the region of 200-400 nm in different solvents and the maximum wavelength was determined in respective solvents. Then the calibration curve was drawn.
In Octanol
100 µg/ml stock solution of eugenol was prepared in octanol by dissolving 10 mg eugenol in 100 ml octanol. Stock solution was suitably diluted to get the concentrations of 1, 2, 3, 4, 5, 6, 7, 8, 9, and 10 µg/ml. The solutions were scanned to determine λmax using blank as octanol. Different sample concentrations were analyzed by UV spectrophotometer at λmax 282 nm and the absorbance was noted. Using MS- Excel, calibration curve was drawn. Process was repeated for 3 times for precision and accuracy.
In Ethanol
1000 µg/ml stock solution of Eugenol was prepared in ethanol. Stock solution was suitably diluted to get concentrations of 10, 20, 30, 40, 50, 60, 70, 80, 90, and 100 µg/ml. The solutions were scanned to determine λmax using blank as ethanol. Different sample concentrations were analyzed by UV spectrophotometer at λmax 281.5 nm and the absorbance was noted. Using MS- Excel, calibration curve is drawn. Process was repeated for 3 times for precision and accuracy.
In PBS pH 7.4: Propylene glycol (9:1)
1000 µg/ml stock solution of Eugenol was prepared in mixture of PBS 7.4 and propylene glycol (9:1). Stock solution was suitably diluted to get concentrations of 10, 20, 30, 40, 50, 60, 70, 80, 90, and 100 µg/ml. The solutions were scanned to determine λmax using blank as mixture of PBS 7.4 and propylene glycol (9:1). Different sample concentrations were analyzed by UV spectrophotometer at λmax 281.5 nm and the absorbance was noted. Using MS- Excel, calibration curve is drawn. Process was repeated for 3 times for precision and accuracy.
Solubility Analysis
Solubility of Eugenol was determined in distilled water, PBS 7.4, ethanol. Excess amount of eugenol was added to 2 ml of water in an eppendorf tube sealed and protected from sunlight. The sealed tubes were then placed in incubator shaker. The temperature was adjusted to 37°C. The sample was filtered after 48 hrs and was analyzed by UV spectrophotometer. Concentration of eugenol was determined from the calibration curve.
Partition Coefficient
Partition coefficient of Eugenol was calculated following the same procedure as described earlier.
Drug Excipient Compatibility Studies
Compatibility of drugs and excipients is studied by performing FTIR and DSC analysis of dacarbazine, eugenol and lipid individually, and also of the physical mixture of drugs and lipid.
By FTIR Analysis
FTIR analysis of Dacarbazine, and Lipoid S100 was carried out using Shimadzu FTIR system (Kyoto, Japan) by potassium Bromide (KBr) pellet technique. Sample was dispersed and triturated with dry KBr (5% wt. of sample), ground well in mortar and pestle and KBr disk was prepared at a pressure of 1000 psig. The disk was placed in the FTIR sample holder and IR spectra in absorbance mode were obtained in the spectral region 400 to 4000 cm-1. FTIR analysis of Eugenol and physical mixture was carried out using Spectrum Two ATR- FTIR Spectrophotometer (Perkin Elmer) containing ATR diamond crystal.
By Differential Scanning Calorimetry (DSC)
Thermal investigation of Dacarbazine and Lipoid S100, and mixture was performed by using Perkin Elmer Pyris 6 DSC (MA, USA). 5 mg of the sample was placed in aluminum pan and crimped with a lid containing a pin hole which was kept in the DSC unit. Heating range was 40-300oC.
Simultaneous Estimation
Simultaneous estimation of both the drugs during loading and release studies was difficult because of their opposite nature. Also, dacarbazine could not be estimated by HPLC because it produces active metabolites, so LC-MS was a suitable estimation technique for dacarbazine; but then, eugenol could not be estimated by either HPLC or LC-MS, as it is a volatile liquid. Keeping the easy availability and several other advantages of UV spectroscopy (Dehghani Mohammad Abadi et al. 2012; Zeng et al. 2012) in mind, we developed a robust, reproducible UV method based on absorptivity measurement for the simultaneous estimation of these two drugs (Murtaza et al. 2011). UV spectrometric method for quantification of dacarbazine (Bei et al. 2010) and eugenol (Peng et al. 2015) are available separately, but we developed a method for their simultaneous determination.
Selection Of Appropriate Solvent Systems
Selecting a suitable solvent system was a challenge since both the drugs are of different nature (one hydrophilic and other lipophilic). For drug loading determination, a solvent which could dissolve both dacarbazine and eugenol as well as lipid (the entire drugs loaded liposome) was needed. For the release study, the solvent had to be appropriate which could dissolve both the drugs but not the lipid. So, various solvent systems like PBS + Triton X, PBS + methanol, PBS + Tween 80, and PBS + propylene glycol were tried to select an appropriate solvent with good suitability and stability.
Stock Solutions Dacarbazine
Stock solution of dacarbazine (100 μg/ml) was prepared by dissolving 100 mg dacarbazine in 1000 ml PBS (pH 7.4) : propylene glycol (9:1) in 1000 ml volumetric flask with vigorous shaking. This stock solution was diluted further to obtain working solutions of different concentrations (1-10 μg/ml).
Determination of absorbance maximum (λmax):
Dacarbazine solution of 5 μg/ml concentration was prepared by appropriately diluting the stock solution. This solution was scanned in UV spectrophotometer in the UV range (200– 400 nm) to determine the λmax of the dacarbazine which was found to be 331 nm (denoted as λ1) for this solvent system.
Eugenol
Stock solution of eugenol (1000 μg/ml) was prepared by dissolving 100 mg eugenol in 100 ml of PBS (pH 7.4): propylene glycol (9:1) in 100 ml volumetric flask with vigorous shaking. This stock solution was diluted further to obtain working solutions of different concentrations (10-100 μg/ml).
Determination of absorbance maximum (λmax):
Eugenol solution of 50 μg/ml concentration was prepared by appropriately diluting the stock solution. This solution was scanned in UV spectrophotometer in the UV range (200– 400 nm) to determine the λmax of the eugenol which was found to be 281.5 nm (denoted as λ2) for this solvent system.
Method Development
Following the method developed by Murtaza et al. (Murtaza et al. 2011), the concept of Absorptivity is employed to develop a method for simultaneous estimation of both these drugs. The absorptivity (a) is extinction coefficient, which is calculated using following equation:
A = a.C
a = A/C………. (5.1)
Where, a → Absorptivity, A → Absorbance, and C → Concentration (mg/100 ml)
Using equation (1), absorptivities of Dacarbazine and Eugenol were calculated at both λ1 (331nm) and λ2 (281.5nm), for which, the absorbance of any three dilutions (n=3) of Dacarbazine was determined at λ1 (331nm). Then the values of absorbance were divided with corresponding concentrations to calculate the absorptivity of Dacarbazine at λ1. Average of three absorptivity values was taken and denoted as ad1, where ‘a’ denotes absorptivity, ‘d’ denotes dacarbazine and ‘1’ denotes λ1 i.e. 331 nm, meaning, absorptivity of dacarbazine at λ1. Same way, absorbance of dacarbazine dilutions (n=3) was determined at λ2 also, i.e. 281.5nm, and ad2 was calculated, where ‘a’ denotes absorptivity, ‘d’ denotes dacarbazine and ‘2’ denotes λ2 i.e. 281.5 nm, meaning, absorptivity of dacarbazine at λ2. Same process was repeated for eugenol, that is, absorbance of three dilutions of eugenol was determined at λ1 (331nm) and λ2 (281.5nm) separately and ae1 and ae2 were calculated, where ‘a’ denotes absorptivity, ‘e’ denotes eugenol, ‘1’ denotes λ1 (331nm) and ‘2’ denotes λ2 (281.5nm). Next, the method involves the solving of following two simultaneous equations derived from equation (5.1) in order to determine the concentrations of both drugs in unknown samples.
A1 = ad1Cd + ae1Ce (5.2)
A2 = ad2Cd + ae2Ce (5.3)
A1 → Absorbance of test sample at λ1 A2 → Absorbance of test sample at λ2 ad1 → Absorptivity of Dacarbazine at λ1 ad2 → Absorptivity of Dacarbazine at λ2 ae1 → Absorptivity of Eugenol at λ1
ae2 → Absorptivity of Eugenol at λ2
Cd → Concentration of Dacarbazine (to be determined)
Ce → Concentration of Eugenol (to be determined)
For the determination of loading of drugs in the liposomes, the entire process was developed with Ethanol as solvent. Absorbance maximum of dacarbazine in ethanol (λ1 ) was found to be 333 nm; absorbance maximum of eugenol in ethanol (λ2 ) was found to be 282.5 nm. So, absorptivities of dacarbazine and eugenol (in ethanol) were measured at λ1and λ2 separately as described above.
Method Validation
For the validation of the developed method, the standard stock mixture solution of both the drugs was prepared where 100 mg of dacarbazine and 1000 mg of eugenol was dissolved in 1000 ml of the selected solvent system to obtain dacarbazine concentration of 100 μg/ml and eugenol concentration of 1000 μg/ml. This stock solution was then suitably diluted to obtain different concentrations of the drugs in the mixture.
Linearity and Range
To determine the linearity and range of both the drugs, the stock solutions of individual drugs were diluted and used. Dilutions of Dacarbazine stock solution were prepared in the range 1-10 μg/ml and calibration curve was plotted between concentration and absorbance at 331 nm and 281.5 nm separately. Similarly, dilutions of Eugenol stock solution were prepared in the range 10-100 μg/ml and calibration curve was plotted at 331 nm and 281.5 nm separately.
Accuracy
To determine the accuracy of the developed method, three dilutions of the stock mixture solution were prepared. These solutions of known concentrations were then analyzed by the developed method as unknown samples. To further check the accuracy of the developed method, the pre-analyzed sample was separately spiked with extra 50%, 100% and 150% of the drugs concentrations and the mixtures were again analyzed by the developed method.
Precision
To check the precision of the developed method, three different dilutions of stock mixture solution were made and the precision (intra-day and inter-day precision) of the method was assessed by determining the concentrations of both the drugs in the mixture.
Intra-day Precision (Repeatability):
Repeatability of the method was assessed by determining the concentrations of dacarbazine and eugenol in three different dilutions of stock mixture solution at three different times a day.
Inter-day (Intermediate) Precision:
Intermediate precision of the method was assessed by determining the concentrations of dacarbazine and eugenol in three different dilutions of stock mixture solution for three consecutive days.
Limit of Detection
The limit of detection (LoD) is the lowest amount of analyte in a sample which can be detected but not necessarily quantified (Murtaza et al. 2011). LoD is calculated using equation:
LoD = 3.3 × N/B
where ‘N’ is standard deviation of the peak areas of the drugs (n = 3), taken as a measure of noise, and ‘B’ is the slope of the corresponding calibration curve (Jain et al. 2011).
Limit of Quantification
The limit of quantitation (LoQ) is the lowest amount of analyte in a sample which can be quantified with appropriate precision and accuracy (Murtaza et al. 2011). LoQ is calculated using equation:
LoQ = 10 × N/B where ‘N’ and ‘B’ mean same as above
RESULTS AND DISCUSSION
Dacarbazine
Qualitative Analysis Physical Properties
Dacarbazine was a very slightly pinkish white powder. It was crystalline in nature.
UV Spectral Analysis
The λmax of dacarbazine was found to be 331.0 nm in distilled water (figure 5.1). The reported value of the λmax of dacarbazine in distilled water is 333 nm. The absorbance of dacarbazine solution of concentration 5 µg/ml was found to be 0.484.
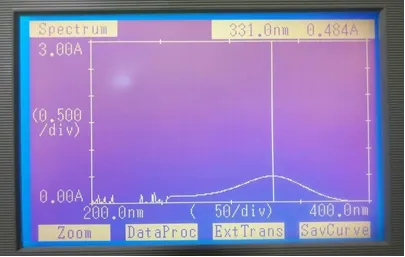
Figure 1: UV Spectrum of Dacarbazine in distilled water
Melting Point Determination
Melting point of dacarbazine was recorded as 203 – 207°C. the reported melting point of dacarbazine is 205°C.
Quantitative Analysis By UV
Sample of Dacarbazine was scanned for the absorption spectrum in the region of 200- 400 nm in different solvents and the maximum wavelength was determined in respective solvents. Calibration curves were drawn.
In Distilled Water
λmax in distilled water was found to be 331.0 nm. Calibration curve was plotted (figure 5.2). Linearity was observed in the concentration range of 1 µg/ml to 10 µg/ml with R2 value of 0.9985.
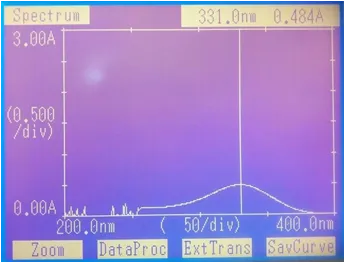
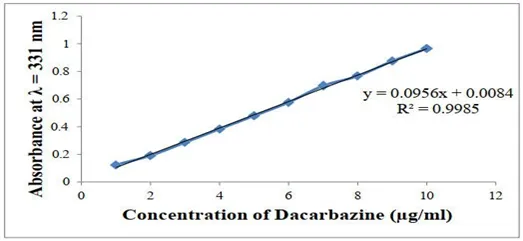
Figure 2: Calibration Curve of Dacarbazine in Distilled Water In PBS (pH 7.4)
λmax in PBS (pH 7.4) was found to be 331.0 nm. Calibration curve was plotted (figure 5.3). Linearity was observed in the concentration range of 1 µg/ml to 10 µg/ml with R2 value of 0.9966.
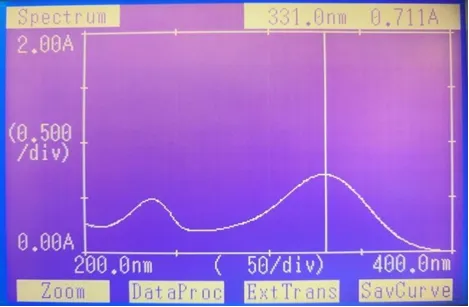

Figure 3: Calibration Curve of Dacarbazine in PBS (7.4)
In PBS 7.4: Propylene Glycol (9:1)
λmax in PBS 7.4 : Propylene Glycol (9:1) was found to be 331.0 nm. Calibration curve was plotted (figure 5.4). Linearity was observed in the concentration range of 1 µg/ml to 10 µg/ml with R2 value of 0.9972.
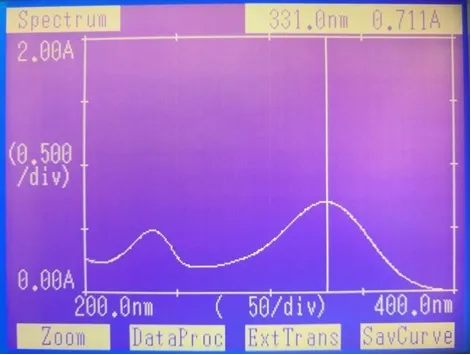
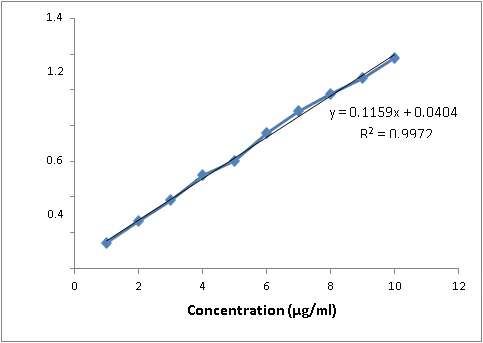
Figure 4: Calibration Curve of Dacarbazine in PBS (7.4) : Propylene Glycol (9:1)
In Ethanol
λmax in ethanol was found to be 330.0 nm. Calibration curve was plotted (figure 5.5). Linearity was observed in the concentration range of 1 µg/ml to 10 µg/ml with R2 value of 0.9924.
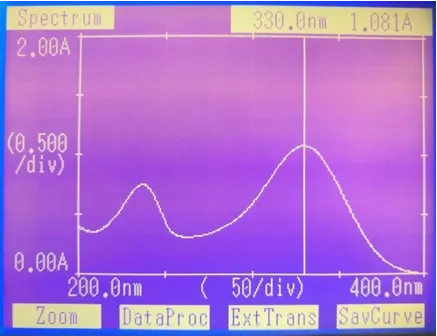

Figure 5: Calibration Curve of Dacarbazine in Ethanol
Solubility Analysis
The solubility if dacarbazine in different solvents is given in table 5.3.
Table 1: Solubility of Dacarbazine
|
Solvent |
Solubility |
Inference |
|
Distilled Water |
5.75±0.32 mg/ml |
Slightly Soluble |
|
Ethanol |
17.1±2.56 mg/ml |
Sparingly Soluble |
|
Phosphate Buffer Saline |
4.45±0.84 mg/ml |
Slightly Soluble |
Partition Coefficient
The observed partition coefficient of dacarbazine was -0.23 ± 0.002 while reported is - 0.24. Hence, the observed partition coefficient was in close proximity to the reported value. The value also indicates that the drug is hydrophilic and has very less affinity for oil phase.
Eugenol
Qualitative Analysis Physical Properties
Eugenol was translucent yellow in color. It had strong odor of cloves.
UV Spectral Analysis
λmax of eugenol in ethanol was found to be 282.5 nm. The absorbance of eugenol solution of concentration 50 µg/ml was found to be 0.541 (figure 5.6). Reported λmax of eugenol in ethanol is 282 nm (Indalkar and N.h 2015).
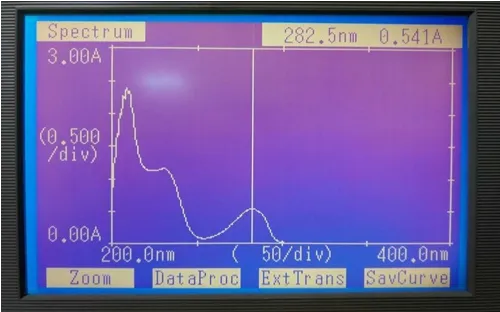
Figure 6: UV Spectrum of Eugenol in Ethanol
Quantitative Analysis
Sample of Eugenol was scanned for the absorption spectrum in the region of 200-400 nm in different solvents and the maximum wavelength was determined in respective solvents. Then the calibration curve was drawn.
In Octanol
λmax of eugenol in octanol was found to be 281.5 nm. Calibration plot was plotted (figure 5.7). Linearity was observed in the concentration range of 1 µg/ml to 10 µg/ml with R2 value of 0.9923.
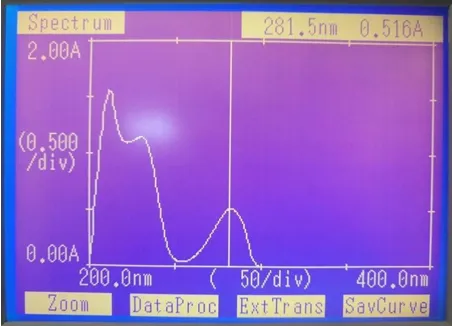

Figure 7: Calibration Curve of Eugenol in Octanol
In Ethanol
λmax of eugenol in ethanol was found to be 282.5 nm. Calibration plot was plotted (figure 5.8). Linearity was observed in the concentration range of 10 µg/ml to 80 µg/ml with R2 value of 0.9903.
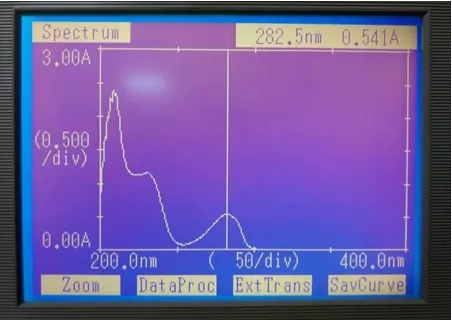
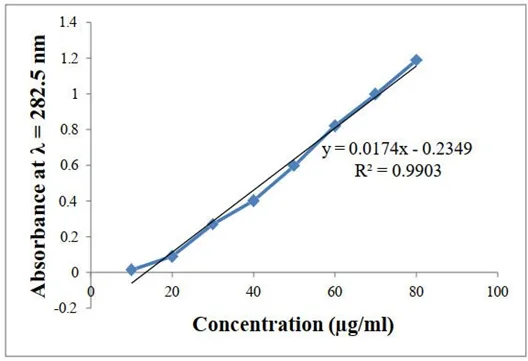
Figure 8: Calibration Curve of Eugenol in Ethanol
In PBS 7.4: Propylene Glycol (9:1)
λmax of eugenol in PBS 7.4 : Propylene Glycol (9:1) was found to be 281.5 nm. Calibration plot was plotted (figure 5.9). Linearity was observed in the concentration range of 10 µg/ml to 100 µg/ml with R2 value of 0.9904.
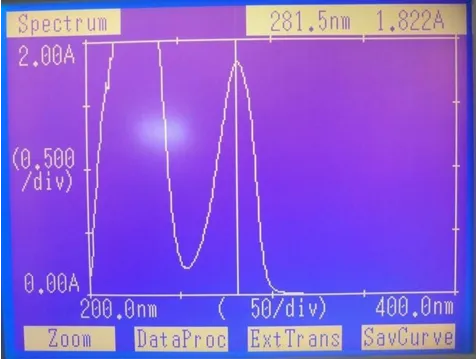
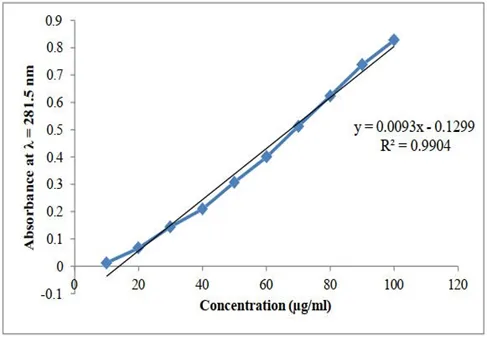
Figure 9: Calibration Curve of Eugenol in PBS 7.4: Propylene Glycol (9:1)
Solubility Analysis
The solubility of Eugenol was checked in different solvents, values are given in table 5.4.
Table 2: Solubility of Eugenol
|
Solvent |
Solubility |
Inference |
|
Distilled Water |
- |
Insoluble |
|
Ethanol |
9.8 ± 0.25 mg/ml |
Slightly soluble |
|
Phosphate Buffer Saline |
- |
Insoluble |
Partition Coefficient
The partition coefficient of the Eugenol was observed to be 2.28 ± 0.17 while reported is 2.49. Hence, both the values are very close. Also, the value of partition coefficient suggests that eugenol is a very lipophilic agent.
Drug-Excipient Compatibility Studies
By FTIR
Drugs-excipients compatibility was studied by FTIR analysis of individual components and physical mixture. FTIR spectra of dacarbazine, eugenol, lipoid S100 and physical mixture of all are shown in figures 5.10, 5.11 and 5.12, and tables 5.5 and 5.6. Characteristic peaks of dacarbazine, eugenol and lipoid S100 could be seen in the spectrum of physical mixture, indicating towards no chemical reactions between the drugs and excipients.
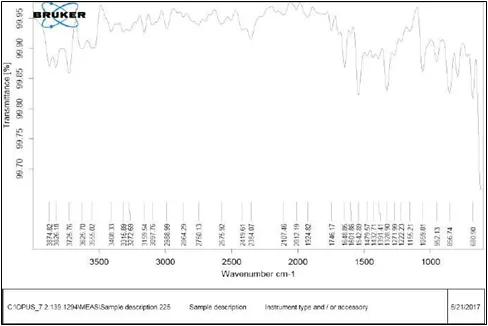
Figure 10: FTIR of Dacarbazine
Table 5.5: FTIR of Dacarbazine
|
Wavelength |
Functional Group |
|
|
Reported |
Observed |
|
|
3399 |
3408.33 |
NH2 |
|
3263 |
3272.69 |
NH2 |
|
3162 |
3159.54 |
NH (H bonded) |
|
2985 |
2988.99 |
CH3 |
|
1655 |
1648.85 |
C=O |
|
1606 |
1601.86 |
(NH2)+(CO) |
|
1536 |
1542.89 |
(C-C)+(NH) |
|
1474 |
1479.57 |
(CH3)+(NN) |
|
1435 |
1432.71 |
(CH3)+(NN) |
|
961 |
952.13 |
(NH)-(NCN) |
|
682 |
680.90 |
OCNH2 |
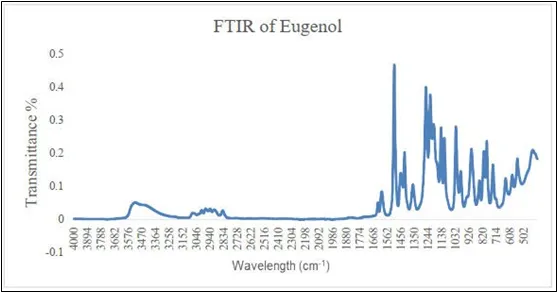
Figure 11: FTIR of Eugenol
Table 3: FTIR of Eugenol
|
Wavelength |
Functional Group |
|
|
Reported |
Observed |
|
|
3513 |
3519 |
OH |
|
3003 |
3077 |
CH2 |
|
3003 |
3004 |
CH3 |
|
2972 |
2975 |
CH2 |
|
2939 |
2939 |
CH3 |
|
2906 |
2906 |
CH3 |
|
2842 |
2842 |
CH2 |
|
1637 |
1638 |
C=C |
|
1463 |
1462 |
CH2 |
|
1366 |
1366 |
COH |
|
1205 |
1205 |
COH |
|
993 |
995 |
C-H |
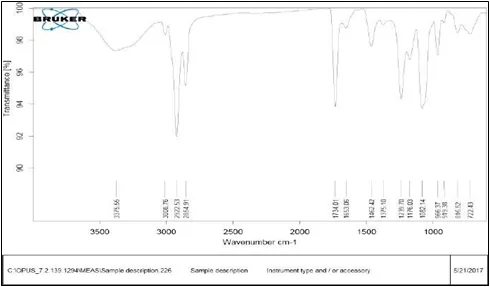
Figure 12: FTIR of Lipoid S100
Figure 13: Drugs-Excipients Compatibility by FT-IR
Table 4: Drugs-Excipients Compatibility by FT-IR
|
Dacarbazine |
Eugenol |
Lipid |
|||
|
Reported |
Observed |
Reported |
Observed |
Reported |
Observed |
|
2985 |
2988 |
3003 |
3007 |
3006 |
3007 |
|
1755 |
1738 |
2939 |
2927 |
2922 |
2927 |
|
1606 |
1602 |
2842 |
2854 |
2854 |
2854 |
|
1516 |
1513 |
1638 |
1639 |
1734 |
1738 |
|
1474 |
1463 |
1463 |
1463 |
1643 |
1639 |
|
1435 |
1432 |
1367 |
1370 |
1462 |
1463 |
|
961 |
968 |
1201 |
1207 |
1375 |
1370 |
|
653 |
648 |
1032 |
1035 |
1239 |
1233 |
|
|
|
994 |
994 |
1156 |
1150 |
|
|
|
|
|
1082 |
1084 |
|
|
|
|
|
966 |
968 |
|
|
|
|
|
919 |
911 |
|
|
|
|
|
816 |
817 |
|
|
|
|
|
742 |
745 |
By DSC
Given below (figure 5.14) is the DSC curve of dacarbazine. An endothermic peak was observed at 215°C. Figure 5.15 represents the DSC curve of the lipid.
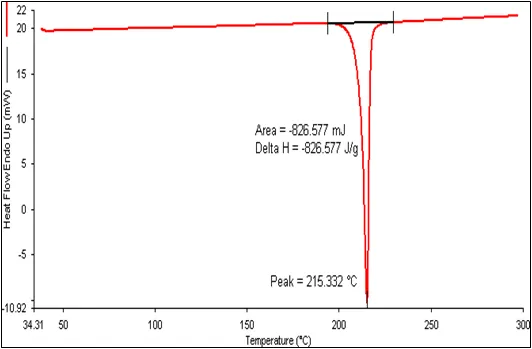
Figure 14: DSC of Dacarbazine
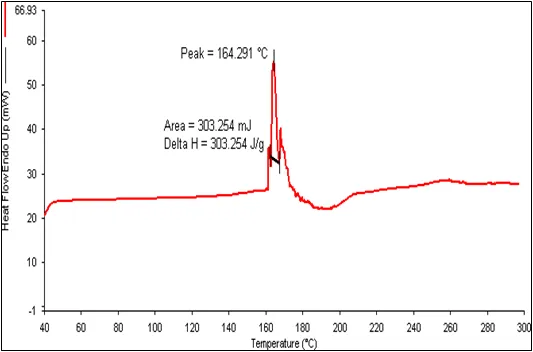
Figure 15: DSC of Lipoid S100
DSC curve of physical mixture of drugs and excipients was recorded (figure 5.16). No peaks of dacarbazine and eugenol were seen, indicating that lipid, in its melted form, dissolved the drugs.
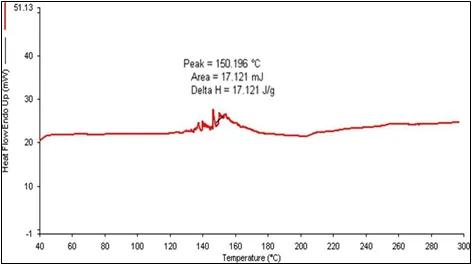
Figure 16: Drugs-Excipients Compatibility by DSC
Simultaneous Estimation
UV spectrophotometric method based on absorptivity measurements for simultaneous estimation was successfully developed and employed for the determination of drug loading and drug release form the dual drugs loaded liposomes.
Selection of Appropriate Solvent Systems
For determination of loading and release of drugs from the liposomes, suitable and appropriate solvents were to be selected. Since dacarbazine is hydrophilic and eugenol is lipophilic in nature, solvents which could dissolve both hydrophilic and lipophilic agents were needed. For this, various solvent systems were screened. For drugs release study, various solvent systems were tried. PBS (pH 7.4) was combined with co-solvents, such as methanol, to increase the solubility of eugenol, but these systems were unstable because of the volatile nature of these co-solvents. Then PBS + Triton X was tried but it interfered with the absorbance of both drugs. Tween 80, when added to PBS, interfered with the absorbance of dacarbazine. Finally, PBS (7.4) + Propylene glycol (9:1) was selected as it was stable, could dissolve both drugs, and did not interfere with the absorbance of any of the drugs. For the determination of drugs loading, Ethanol was found to be a suitable solvent because it could dissolve both the drugs as well as the lipid (i.e. the entire liposome).
Method Development
Absorptivity values of both the drugs at both the λmax (for PBS: Propylene glycol and Ethanol) were calculated, and were put in equations (5.2) and (5.3). The absorptivity of the Dacarbazine at λ1 (ad1) was found to be 949.64 ± 11.43 The absorptivity of the Dacarbazine at λ2 (ad2) was found to be 319.93 ± 6.67 The absorptivity of the Eugenol at λ1 (ae1) was found to be 30.59 ± 0.98
The absorptivity of the Eugenol at λ2 (ae2) was found to be 138.36 ± 1.32
Putting all the four absorptivity values in equations (5.2) and (5.3), we get following equations:
A1 = 949.64 Cd + 30.59 Ce. (5.4)
A2 = 319.93 Cd + 138.36 Ce. (5.5)
The concentrations of dacarbazine and eugenol in the test samples could then be determined by simply putting absorbance of the test samples at both λ1 and λ2 (A1 and A2) in equations (5.4) and (5.5) and solving them for Cd (concentration of dacarbazine) and Ce (concentration of eugenol). When ethanol was taken as the solvent, the absorptivity values were found to be: a et= 1005 ± 15
ad2et= 616 ± 02
ae1et= 72.24 ± 1.62
ae2et= 144.21 ± 6.29
Putting these values in equations (5.3) and (5.4), we obtain following equations: A1 et = 1005 Cd et + 72.24 Ce et (5.6)
A2 et = 616 Cd et + 144.21 Ce et (5.7)
Now, same as earlier, putting values of absorbance of the test samples in equations (5.6) and (5.7), concentrations of the two drugs in the ethanol could be determined. Multiplying by the dilution factor, entrapped (loaded) amounts of both the drugs could be calculated.
Method Validation Linearity and Range
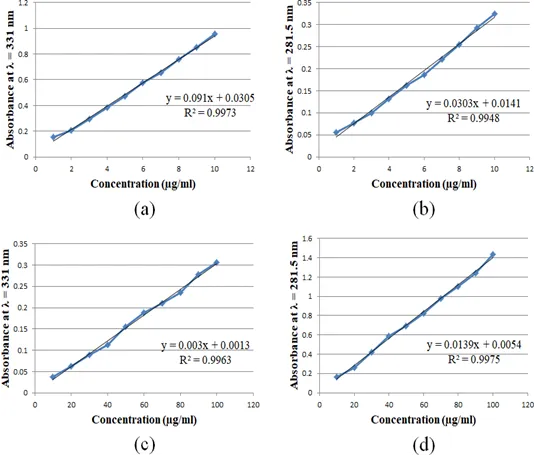
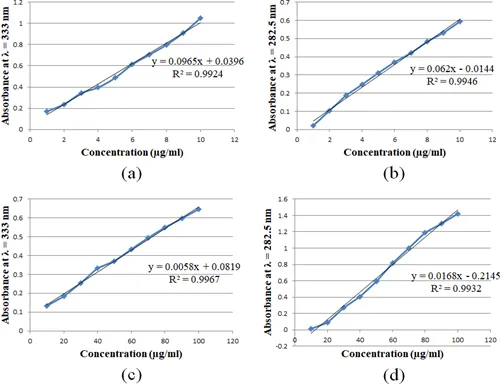
The absorbance vs concentration curve of both the drugs at both the λmax obeyed Beer- Lambert’s law in tested concentration range (1-10 µg/ml for Dacarbazine and 10-100 µg/ml for Eugenol). The values of regression coefficient (R2) for Dacarbazine and Eugenol at both λmax indicate a good correlation between the concentration and absorbance within the concentration range tested. Figure 5.17 shows all the curves while the data is summarized in table 5.8 with PBS: Propylene glycol and ethanol as solvents.
(i)
(ii)
Figure 5.17: Standard Plots (i) PBS (pH 7.4): Propylene Glycol (a) Dacarbazine at 31 nm (λ1) (b) Dacarbazine at 281.5 nm (λ2) (c) Eugenol at 331 nm (λ1) (d) Eugenol at at 281.5 nm; (ii) Ethanol (a) Dacarbazine at 333 nm (λ1) (b) Dacarbazine at 282.5 nm (λ2) (c) Eugenol at 333 nm (λ1) (d) Eugenol at at 282.5 nm
Table 5 Optical parameters and regression values of dacarbazine and eugenol
|
Parameters |
Dacarbazine |
Eugenol |
||
|
PBS: Propylene Glycol |
||||
|
Wavelength |
331 nm (λ1) |
281.5 nm (λ2) |
331 nm (λ1) |
281.5 nm (λ2) |
|
Beer’s Law limit |
1-10 μg /ml |
1-10 μg /ml |
10-100 μg /ml |
10-100 μg /ml |
|
Regression equation(Y)
Slope (m) |
Y=0.091x + 0.0305 0.091 |
Y=0.0303x + 0.0141 0.0303 |
Y=0.003x + 0.0013 0.003 |
Y=0.0139x + 0.0054 0.0139 |
|
Intercept (c) |
0.0305 |
0.0141 |
0.0013 |
0.0054 |
|
Correlation coefficient (R2) |
0.9973 |
0.9948 |
0.9963 |
0.9975 |
|
Ethanol |
||||
|
Wavelength |
333 nm (λ1) |
282.5 nm (λ2) |
333 nm (λ1) |
282.5 nm (λ2) |
|
Beer’s Law limit |
1-10 μg /ml |
1-10 μg /ml |
10-100 μg /ml |
10-100 μg /ml |
|
Regression equation(Y) |
Y=0.0965x + 0.0396 |
Y=0.062x - 0.0144 |
Y=0.005x + 0.0819 |
Y=0.0168x - 0.2145 |
|
Slope (m) |
0.0965 |
0.062 |
0.0058 |
0.0168 |
|
Intercept (c) |
0.0396 |
-0.0144 |
0.0819 |
-0.2145 |
|
Correlation coefficient (R2) |
0.9924 |
0.9946 |
0.9967 |
0.9932 |
Accuracy
As the standard addition technique was followed by adding 50, 100 and 150% of the drugs concentration in the pre-analyzed samples, the % recoveries of the three concentrations were found to be 99.23 ± 0.85 for dacarbazine and for 101.04 ± 0.98 eugenol, which indicates high accuracy of the developed analytical method. Data is summarized in table 5.9.
Precision
The absorbance of three different dilutions of stock mixture solution was measured three times a day and % RSD values (table 5.9) were calculated to obtain the intraday variations. %RSD was found to be 0.54 – 1.16 for dacarbazine and 0.94 – 1.58 for eugenol, which indicate good repeatability of the method.
The absorbance of three different dilutions of stock mixture solution was measured daily for three consecutive days to calculate % RSD values (table 3) and calculate interday variations. Results of precision studies are summarized in table 3. Low values of % RSD for inter-day precision (0.82 – 1.60 for dacarbazine and 1.15 – 1.86 for eugenol) suggest good intermediate precision of the developed UV absorptivity analytical method.
Limit of Detection
Limit of detection of dacarbazine was found to be 0.32 µg/ml. Limit of detection of eugenol was found to be 4.60 µg/ml.
Limit of Quantification
Limit of quantification of dacarbazine was found to be 0.62 µg/ml. While, limit of quantification of eugenol was found to be 7.56 µg/ml. Table 5.9 summarizes the validation data of the developed UV analytical method for the quantification of dacarbazine and eugenol in PBS (7.4): Propylene glycol (9:1). As the same complete process was repeated to also develop the estimation method with ethanol as solvent, the method was validated too. Table 5.9 also summarizes the validation data for both drugs when ethanol was taken as solvent
Table 6 Method Validation Data
|
Validation Parameters |
Dacarbazine |
Eugenol |
||
|
Linearity Range |
1-10 µg/ml |
10-100 µg/ml |
||
|
Accuracy (Mean Recovery) |
99.23 ± 0.85 |
101.04 ± 0.98 |
||
|
Precision |
Intra-day |
0.54 – 1.16 |
0.94 – 1.58 |
|
|
|
Inter-day |
0.82 – 1.60 |
1.15 – 1.86 |
|
|
Limit of Detection (LoD) |
0.32 µg/ml |
4.60 µg/ml |
||
|
Limit of Quantification (LoQ) |
0.62 µg/ml |
7.56 µg/ml |
||
|
Ethanol |
||||
|
Linearity Range |
1-10 µg/ml |
10-100 µg/ml |
||
|
Accuracy (Mean Recovery) |
98.82 ± 1.15 |
101.46 ± 0.89 |
||
|
Precision |
Intra-day |
0.45 – 1.62 |
0.84 – 1.68 |
|
|
Inter-day |
1.02 – 1.94 |
1.23 – 1.75 |
||
|
Limit of Detection (LoD) |
0.24 µg/ml |
3.46 µg/ml |
||
|
Limit of Quantification (LoQ) |
0.49 µg/ml |
5.80 µg/ml |
||
Methods
Synthesis of Nanoliposomes
Nanoliposomes were synthesized by solvent injection method using ethanol a
organic solvent Lipid and cholesterol were dissolved in ethanol. This constituted the organic phase. Then the eugenol was dissolved in this organic phase because of its lipophilic nature. Separately, dacarbazine was dissolved in distilled water which constituted the aqueous phase. This aqueous phase was then kept on stirring (1000 rpm) and the organic phase was rapidly injected into it using a syringe of 1 ml capacity and 24gauge needle size. Volume of ethanol was fixed at 5 ml. Figure 6.1 gives a pictorial representation of the method of preparation of dual drugs loaded nanoliposomes.
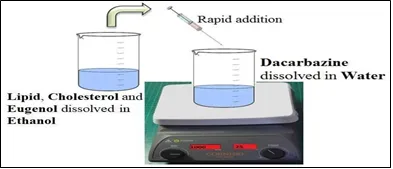
Figure 17: Method of Preparation of dual loaded Nanoliposomes
Optimization Of Formulation By QBD
To synthesize the dual loaded liposomes with optimum characteristics, Central composite design was chosen and applied using Design Expert® version 11.0.0 by Stat-Ease, Inc. (Suite 480, Minneapolis, MN, USA). Central Composite Design (CCD) was chosen for the optimization of the formulation because it generates greater number of runs as compared to other designs in the Design Expert software (Kumar, Ali, and Baboota 2016). Since the formulation had to be loaded with two drugs, and the desired characteristics of the formulation were specific (explained later), the formulation was optimized by applying central composite design at two levels, i.e., twice. Each variable was set at low (-1) and high (1) levels. The software itself took a middle value (0) also, and generated combinations with three different values, -1 (low), 0 (medium) and +1 (high).
First Level Initial Risk Assessment
Critical quality attributes (CQAs) are the quality aspects of the final product which are critical for its performance and are to be optimized. Out of different quality attributes such as particle size, PDI, drug loading and entrapment efficiency, particle size and entrapment efficiency were selected as CQAs for initial risk assessment. Critical material attributes (CMAs) and critical process parameters (CPPs) are the material and process variables respectively that are expected to affect and alter the quality (CQAs) of the final formulation. According to the literature surveyed and results of the preliminary experiments, various CMAs and CPPs were identified, namely:
CMAs: Lipid concentration, Drug concentration, Lipid: Cholesterol CPPs: Water: Ethanol, Stirring speed, Stirring time
The effect of all these CMAs and CPPs was assessed to identify the intensity of their impact and the appropriate range of each variable. The conclusions are summarized in table 6.1.
Table 7: Initial Risk Assessment (First level)
|
Variables |
Relative Impact on CQAs |
Suitable Range |
|
|
Size |
Entrapment Efficiency |
||
|
CMAs |
|
|
|
|
Lipid Concentration |
High |
Medium |
10 mg/ml - 30 mg/ml |
|
Drug Concentration |
Medium |
High |
1 mg - 3 mg |
|
Lipid:Cholesterol |
Low |
Medium |
2 |
|
CPPs |
|
|
|
|
Water:Ethanol |
High |
Medium |
3 – 5 |
|
Stirring speed |
Medium |
Low |
1000 rpm |
|
Stirring time |
Low |
Low |
60 minutes |
Design of Experiment
First level design of experiment (DoE) was applied to first optimize single drug (dacarbazine) loaded liposomes to select the optimum lipid concentration and water:ethanol ratio to synthesize liposomes with minimum size and good entrapment of base drug, i.e., dacarbazine. As stated in table 6.2, three independent variables (denoted as Factors) were selected. Factor 1 was Lipid concentration (mg/ml), i.e. amount of lipid to be taken and dissolved in ethanol. Low level (-1) was fixed at 10 mg/ml and high level (+1) was fixed at 30 mg/ml. Factor 2 was water:ethanol ratio, with low level value of 3 (-1), and high level value of 5 (+1). Factor 3 was drug concentration, i.e. amount of dacarbazine to be dissolved in water. The values selected for drug concentration were 1 mg/ml (low level, - 1) and 3 mg/ml (high level, +1). Two dependent variables (final characteristics of the formulation, denoted as Responses) were selected which were actually the main criteria for the suitability of the formulations. Response 1 was size, and response 2 was entrapment efficiency of the dacarbazine.
Lipid: cholesterol ratio, stirring speed and stirring time were taken as fixed variables. By preliminary analysis of factors affecting the formulation outcomes, stirring time and stirring speed were fixed at 60 minutes and 1000 rpm respectively, as it was found that these values produced optimum results.
Cholesterol: Lipid ratio was also fixed at 1:2 in accordance with the results obtained in preliminary studies.
Table 8: DoE Variables (First level)
|
Independent Variables |
Levels |
||
|
|
-1 |
0 |
+1 |
|
Factor 1: Lipid Concentration (mg/ml) |
10 |
20 |
30 |
|
Factor 2: Water:Ethnaol |
3 |
4 |
5 |
|
Factor 3: Drug Concentration (mg/ml) |
1 |
2 |
3 |
|
Dependent Variables |
Constraints |
||
|
Response 1: Size (nm) |
Minimum |
||
|
Response 2: Entrapment Efficiency (%) |
Maximum |
||
|
Fixed Variables |
Fixed Values |
||
|
Stirring Time |
60 minutes |
||
|
Stirring Speed |
1000 rpm |
||
|
Cholesterol: Lipid |
1:2 |
||
Second Level Initial Risk Assessment
In addition to the variables fixed previously, lipid concentration and water:ethanol ratio were also fixed in the second level CCD. The values of these 2 factors were fixed at the optimum value as suggested by the first level CCD. All values are summarized in table 6.3.
Design of Experiment
Second level DoE was applied to determine the right concentration of both the drugs to be taken in order to produce nanoliposomes with minimum size and maximum ratio of entrapped eugenol to entrapped dacarbazine (Eugenol: Dacarbazine). Two independent variables (factors) were selected; factor 1 was concentration of dacarbazine, and factor 2 was concentration of eugenol. The fixed values of Factor 1 (dacarbazine concentration) were 1 mg/ml (low level, -1) and 3 mg/ml (high level, +1). Minimum concentration of eugenol (Factor 2) was fixed at 5 mg/ml (-1) and maximum concentration taken was 10 mg/ml (+1) (Table 6.3).
Table 9: DoE Variables (Second level)
|
Independent Variables |
Levels |
||
|
|
-1 |
0 |
+1 |
|
Factor 1: Dacarbazine Concentration (mg/ml) |
1 |
1.5 |
2 |
|
Factor 2: Eugenol Concentration (mg/ml) |
5 |
7.5 |
10 |
|
Dependent Variables |
Constraints |
||
|
Response 1: Size (nm) |
Minimum |
||
|
Response 2: Eugenol:Dacarbazine |
Maximum |
||
|
Fixed Variables |
Fixed Values |
||
|
Lipid Concentration |
13.168 mg/ml |
||
|
Water: Ethanol |
5 |
||
|
Stirring Time |
60 minutes |
||
|
Stirring Speed |
1000 rpm |
||
|
Cholesterol:Lipid |
1:2 |
||
Three-dimensional response surface plots were obtained using the software to illustrate the effect of selected factors (independent variables) on the responses (dependent variables). Analysis of variance (ANOVA) was applied on the obtained responses. The equations for each independent variable were generated by using values of coefficients. The values of responses obtained were fitted in different models, namely, linear, two factor interaction (2F1), quadratic and cubic models. Based on the data obtained from lack of fit tests and model summary statistics, suitable model was selected and applied. Constraints were applied on dependent variables and optimized formulation with highest desirability factor was selected using numerical technique.
Preparation of HA Coated (Surface Functionalized) Nanoliposomes
To actively target the nanoliposomes to cancer cells, the surface of optimized liposomes was coated with hyaluronic acid (HA) which has special affinity for CD44 receptors that are overexpressed by most of the cancer cell lines. HA is anionic in nature due to the presence of carboxyl groups, and to employ ionic interaction method for coating, the nanoliposomes had to have a cationic surface. The nanoliposomes prepared using Lipoid S100 were anionic and had negative surface charge as revealed by zeta potential studies. So to make cationic nanoliposomes, CTAB (cetyl tetra ammonium bromide) was used. Briefly, 10 mg CTAB was dissolved along with lipid, cholesterol, and eugenol in the ethanol. This ethanolic phase was added to aqueous phase containing dacarbazine under stirring. The ethanol was later evaporated to obtain drugs loaded cationic nanoliposomes. Separately, HA solutions of four different concentrations (0.005%, 0.01%, 0.05%, 0.1%) were prepared by dissolving HA in water and stirring for 60 minutes. To coat the HA on nanoliposomes, 10 ml of optimized cationic liposomal suspension was added into 5 ml of HA solution. The addition was done under stirring and stirring was continued for 4 hours (Negi et al. 2015). The process is represented in figure 6.2
In Vitro Characterization
Particle Size, Size Distribution, And Zeta Potential
Blank liposomes (BL), dacarbazine loaded liposomes (DL), dacarbazine and eugenol loaded liposomes (DEL), and dacarbazin and eugenol loaded surface coated liposomes (DELC) were scanned for the said parameters. The mean particle size and poly dispersity index (PDI) of the different liposomes were determined by dynamic light scattering using particle size analyzer (Delsa Nano C, Beckman Coulter Counter). Liposomal suspension was diluted 10 times using distilled water and this diluted suspension was put in particle size analyzer to obtain results. As the zeta potential is one of the major determinants of the stability of the nanoformulations, it too was determined, using Delsa Nano C Zetasizer by the same procedure.
Electron Microscopy
To confirm the size of the nanoliposomes and ascertain the successful coating on the surface, electron microscopic analysis was performed. For Scanning Electron Microscopy (SEM), the sample was coated with gold and then kept in the sampling unit as a thin film. The photographs were taken at different magnifications using Scanning Electron Microscope (Jeol, Japan). For Transmission Electron Microscopy (TEM), a drop of sample was deposited on copper grid coated with fomvar. The grid was then immersed in one drop of 2% phosphotungstic acid for 20 sec and then was allowed to dry. Grid was finally observed under Transmission Electron Microscopy.
DSC
Thermal investigation of DELC was performed by using Perkin Elmer Pyris 6 DSC (MA, USA). 5 mg of the sample was placed in aluminum pan and crimped with a lid containing a pin hole which was kept in the DSC unit. Heating range was 40-300oC.
FTIR Analysis
FTIR analysis of DELC was carried out using Spectrum Two ATR-FTIR Spectrophotometer (Perkin Elmer) containing ATR diamond crystal. The spectral region 400-4000 cm-1 was opted for the sample analysis. The sample was scanned with 4 cm-1 resolution having accumulations of 8. The sample was placed on the crystal and scanned to obtain the spectra.
Drug Loading
To determine the loading of drugs in the synthesized nanoliposomes, the liposomal suspension was centrifuged at 36,000 rpm (Beckman Coulter, OptimaTM L-100K) to remove the unentrapped drugs. The supernatant which contained unentrapped drugs was separated and the pellets of nanoliposomes were dissolved in ethanol. Ethanol, which could dissolve the lipid as well as both drugs, was a suitable solvent for determination of drug loading. Since simultaneous loading of two drugs was to be determined, a novel UV absorptivity method (Shimadzu, Japan) for simultaneous determination of the drugs was developed earlier by the authors. The ethanolic solution of drugs loaded liposomes was suitably diluted and absorbance was measured at λ1et (λmax of dacarbazine in ethanol, i.e. 333 nm) and λ2et (λmax of eugenol in ethanol, i.e. 282.5 nm) against ethanolic solution of unloaded liposomes as blank. These absorbance values (A1 et and A2 et ) were put in the equations (6.1) and (6.2) which were generated by the absorptivity method.
A1 et = 1005 Cd et + 72.24 Ce et (6.1)
A2 et = 616 Cd et + 144.21 Ce et (6.2)
After solving the simultaneous equations, amount of dacarbazine and amount of eugenol present in the formulation was determined by multiplying the concentration of dacarbazine (Cd et) and concentration of eugenol (C et) with dilution factors.
Drug loading of the formulation with respect to both drugs was calculated by using the following formula:
Drug Loading (%) = Amount of drug present in formulation X 100
Total weight of formulation
Entrapment Efficiency
After determining the amount of drugs present in the liposomes, entrapment efficiency of both drugs was calculated by the following formula:
Entrapment efficiency (%) = Amount of drug entrapped X 100
Total amount of drug used
Drug Release
The in vitro release study of dual loaded surface functionalized nanoliposomes was carried out over a period of 72 hours, using the dialysis bag method (Sharma et al. 2014). PBS (pH 7.4): Propylene glycol (9:1) was used as release medium because both the drugs were soluble in this media while lipid was insoluble. The dialysis membrane (MW cut off 8-10 kDa; Spectra/Por® Spectrum Laboratories, Inc, USA) was activated before using as per the instructions given on the packaging. Liposomal suspension was centrifuged as described above. Supernatant was discarded and pellets were dispersed in 10 ml of release media. This dispersion was put in dialysis bag and the bag was suspended in 200 ml of receiving phase i.e. PBS (pH 7.4): Propylene glycol (9:1) and placed into an incubator shaker maintained at 37°C and 100 rpm. Aliquots each of 3 ml were withdrawn at various time points (up to 72 hours). The same volume (3 ml) of the media was replaced after each sampling to maintain the sink condition during the study. Absorbance of samples withdrawn at different time
points (and suitably diluted when needed) was measured at λ1 (λmax of dacarbazine in release media, i.e. 331nm) and λ2 (λmax of eugenol in release media, i.e. 281.5 nm) against pure release media as blank. These absorbance values (A1 and A2) were put in equations (6.3) and (6.4) which were generated by absorptivity method developed using PBS: Propylene glycol (9:1) as solvent.
A1 = 949.64 Cd + 30.59 Ce (3)
A2 = 319.93 Cd + 138.36 Ce (4)
After solving the above simultaneous equations, amount of both the drugs (Cd and Ce) present in the release media at different time points was calculated.
% Release at any point of time = Amount of drug present in the release media X 100
Total amount of drug present in formulation/dialysis bag
Stability Study
The size, PDI and drug content of lyophilized liposomal formulation were studied for 4 weeks and results are summarized in table 6.11. Nanoliposomes were found to be fairly stable as they did not show any remarkable increase in size or PDI; neither had they showed significant reduction in their drug content. This implies that, in the lyophilized form and under suitable storage conditions, formulated nanoliposomes were able to retain their size without any leakage or leeching of drugs.
Table 17: Storage Stability
|
Stability Parameters |
0 weeks |
1 weeks |
2 weeks |
3 weeks |
4 weeks |
|
|
Size (nm) |
125.10±3. 62 |
126.47±2. 16 |
131.8±4.26 |
138.13±6. 1 |
147.94±6. 73 |
|
|
PDI |
0.207±0.0 62 |
0.238±0.0 40 |
0.277±0.08 6 |
0.304±0.0 81 |
0.316±0.0 94 |
|
|
Drug Content (%) |
Dacarbazine |
19.72±0.6 5 |
18.218±0. 81 |
17.132±1.0 3 |
15.95±1.4 5 |
14.824±1. 65 |
|
Eugenol |
48.84±1.7 1 |
46.93±1.8 2 |
43.30±3.04 |
41.046±2. 5 |
40.174±3. 67 |
|
Cell Uptake Study
Since liposomes were coated with HA to favor their uptake in melanoma cells, it was necessary to assess and compare the cellular uptake of the uncoated and coated formulations. For this purpose, rhodamine dye was used. Rhodamine is a fluorescent agent and thus can be traced using flow cytometry. Uncoated (Rh-L) and Coated (Rh- L- C) Rhodamine Liposomes were prepared and tested in B16F10 cells for uptake. As can be seen in figure 7.9 and table 7.7, Rhodamine Solution (Rh-S) showed negligible uptake in the cells, while Rh-L showed higher uptake. This enhanced uptake of Rh-L in comparison to Rh-S can be owed to Enhanced Permeation and Retention (EPR) effect. However, Rh- L-C showed even higher uptake in the melanoma cells. In addition to EPR, HA coating must have contributed to the significantly higher cellular uptake of coated liposomes, supporting the important role of surface functionalization in targeted therapy of melanoma.
Table 18: Cell Uptake in B16F10 Cells
|
Treatment |
M1 Events |
|
Blank |
26 |
|
Rh-S |
303 |
|
Rh-L |
3463 |
|
Rh-L-C |
7474 |
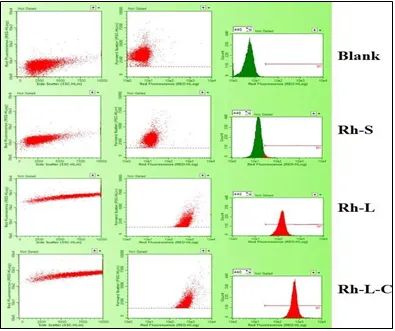
Figure 26: Cell Uptake in B16F10 Cells
Phagocytic Engulfment Study
Since, HA also imparts hydrophilicity to the liposomes, it was anticipated that the liposomes would be long-circulating and avoid phagocytosis by the macrophages. In order to ascertain this, cellular uptake was also assessed in RAW 264.7 cells. RAW 264.7 cells are a macrophage-like, Abelson leukemia virus transformed cell line derived from BALB/c mice. This cell line is a commonly used model of mouse macrophages for the study of cellular responses to microbes and their products (https://www.invivogen.com/raw). Results (figure 7.10 and table 7.8) revealed that uptake of uncoated liposomes by RAW 264.7 cells was almost 200 % more than that of coated liposomes. Thus, HA coating could successfully reduce the macrophage phagocytosis of the liposomes.
Table 19: Phagocytic Engulfment by RAW 264.7 Cells
|
Treatment |
M1 Events |
|
Blank |
25 |
|
Rh-S |
95 |
|
Rh-L |
401 |
|
Rh-L-C |
250 |
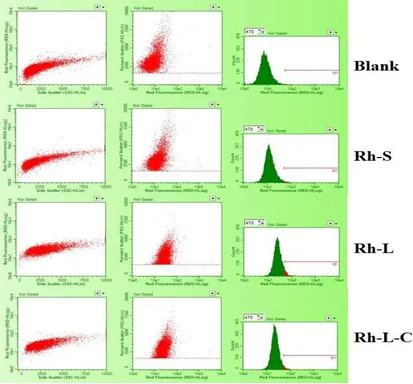
Figure 27: Phagocytic Engulfment by RAW 264.7 Cells
7.1.1. Haemolytic Study
Haemolytic test was performed for DELC using blood from healthy mice. Supernatant of the RBCs having 100% and 0% haemolysis showed absorbance value of 0.234 and 0.002 respectively at 541 nm. Supernatant of RBCs treated with DELC showed absorbance value of 0.006. On calculating, it was found that DELC caused 1.709% haemolysis at a dose of 0.2 mg. Hence, it can be concluded that our formulation is minimally toxic to the RBCs and thus can be safely administered through i.v. route. The competence of a formulation can be ascertained only in in-vivo models. Animal studies give a clear picture of the utility and applicability of the formulation in actual diseased conditions
SUMMARY & CONCLUSION
Keeping the highly resistant and aggressive nature of melanoma in mind, dacarbazine and eugenol loaded liposomes were successfully developed for a combinatorial approach against melanoma. The QbD approach enabled us to synthesize the said anti-melanoma formulation with optimum parameters in the most logical manner. Applying this QbD approach at two levels further made the process easier to reproduce, and more cost- effective. Surface functionalization of the formulation made the entire therapy more targeted to spare normal body cells from unwanted toxicity. In-vitro characterization of the nanoliposomes ascertained the utility of the QbD application. This work is a good example and illustration of the successful application and value of the QbD approach in the development of effective pharmaceutical nanoformulations. The performance of the formulation as an anti- melanoma agent was assessed by cell line studies. Combining eugenol with dacarbazine resulted in much higher anti-melanoma activity of the formulation. This enhancement is supposed to be due to the inhibition of the anti- apoptotic protein survivin, which is overexpressed in the melanoma cells, and makes them resistant towards apoptosis. Including Eugenol has supposedly resulted in downregulation of survivin protein, consequent to which, dacarbazine could perform its function to its maximum potential. In addition to increased apoptosis and cytotoxicity, this combination also promises to inhibit the metastatic potential of the melanoma. Further, HA coating was found to enhance the uptake of the liposomes in B16F10 cells and reduce the phagocytic engulfment by macrophages. Pharmacodynamics study showed significant difference in the tumor volumes after 10 days of the treatment with DELC and Dacarbazine Solution (DS). Results of biodistribution study supported the results of cell uptake study by revealing more concentration of drug from DELC in blood and tumor, and considerably less amount in the liver. Histological analysis of tumor sections showed that there was significantly more necrosis in the DELC treated group. In lungs, metastasis could be seen in the control and dacarbazine solution group, but not in DELC group. Liver toxicity was also not observed in the DELC group, while hemorrhage was seen in DS group. DELC was also found to be safe for blood cells and thus suitable for i.v. administration. Conclusively, combining eugenol with the dacarbazine results in better therapeutic outcomes in the treatment of melanoma and thus can be a hope against this resistant, aggressive and deadly cancer. Thus, the combination of dacarbazine and eugenol holds the promise of overcoming the resistance of melanoma cells and challenges of anti-melanoma therapies.
REFERENCES

Quadri Mohammed Soheb*, Rajeev Kumar Malviya, Formulation & Development of Nanocarrier for Combination Delivery for Skin Cancer, Int. J. Med. Pharm. Sci., 2026, 2 (8), 737-767. https://doi.org/10.5281/zenodo.22109648
 10.5281/zenodo.22109648