View Article

Abstract

Conventional pharmaceutical quality control relies largely on destructive, solvent-intensive and time-consuming methods such as HPLC assay, dissolution testing, Karl Fischer titration and wet-chemical identification. These methods are accurate and well established, but they consume samples, generate waste, and give results only after the batch has already been manufactured. Near-infrared (NIR) and Raman spectroscopy are vibrational techniques that need little or no sample preparation, can measure through packaging or in-line, and provide chemical and physical information within seconds. Both techniques are central to Process Analytical Technology (PAT), real-time release testing (RTRT) and continuous manufacturing. Despite this, their routine industrial adoption is limited by three recurring problems: transfer of calibration models between instruments, sites and batches; robustness of multivariate methods against physical and environmental variation; and the absence of a single harmonised approach to validating spectroscopic methods across tablets, capsules, powders, liquids, semi-solids and parenteral products. This review compares destructive and non-destructive analytical approaches, summarises the principles, instrumentation and chemometrics of NIR and Raman methods, surveys their applications by dosage form, and critically examines calibration transfer algorithms, robustness testing and validation under ICH Q2 (R2) and Q14, USP <1119>/<1120> and the European Pharmacopoeia. Research gaps and future directions, including lifecycle-based model maintenance, are discussed.

Keywords

Raman spectroscopy, near-infrared spectroscopy, non-destructive testing, process analytical technology, calibration transfer, method validation, chemometrics, real-time release testing

Introduction

× Popup Image

Pharmaceutical quality assurance has traditionally been built on end-product testing: a representative sample is removed from the batch, destroyed during analysis, and the batch is released when the results meet specification. Typical examples are HPLC assay and related substances, dissolution, Karl Fischer water determination, titrimetric assay and thin-layer chromatography identification. Although these methods remain the reference standard, they are labour-intensive and they sample only a very small fraction of the product [1]. Regulators and industry have therefore moved toward building quality into the process rather than testing it in afterwards, supported by continuous manufacturing and real-time monitoring [2,3].

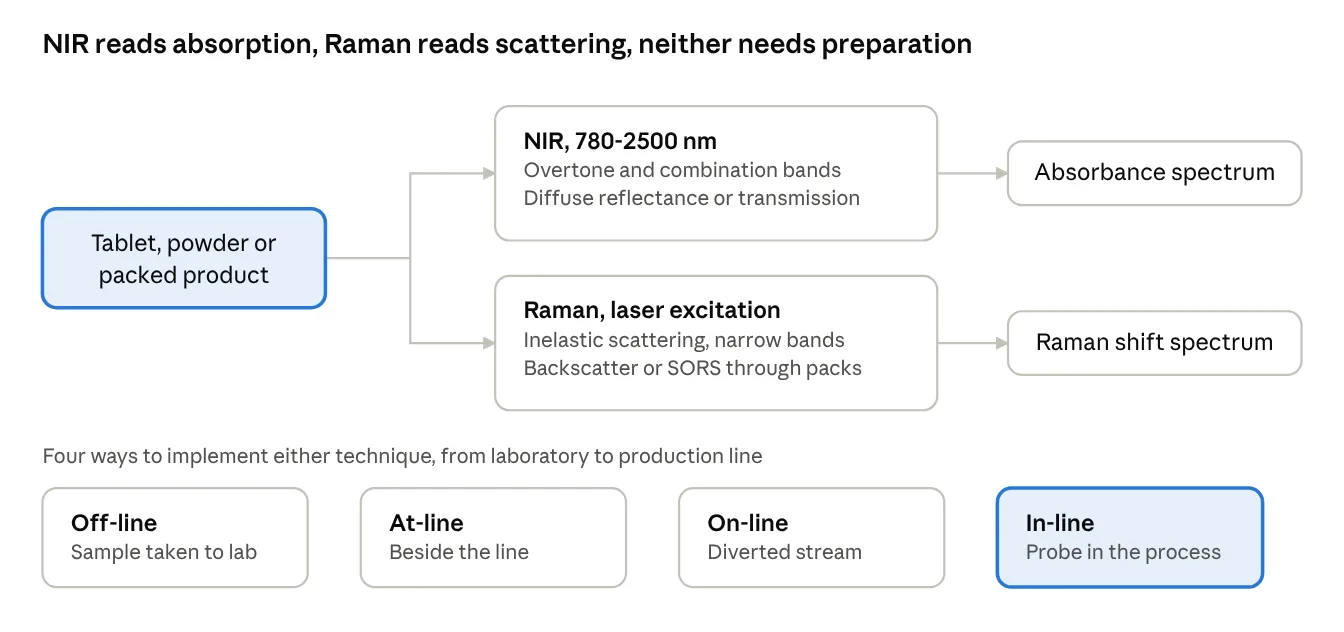
The U.S. FDA's PAT framework formalised this shift by encouraging timely measurement of critical quality and performance attributes during processing [4]. Among available PAT tools, NIR and Raman spectroscopy have received the most attention because they are rapid, require minimal sample preparation, and can be implemented off-line, at-line, on-line or in-line [5-9]. NIR measures overtone and combination bands of C-H, O-H and N-H bonds, while Raman measures inelastic scattering associated with changes in molecular polarisability; the two are complementary [5,8].

However, a spectrum is not a result. NIR and Raman are secondary methods: each requires a multivariate calibration model built against a primary reference method, and that model must be maintained over the life of the product. The principal obstacles to wider adoption are therefore not instrumental but methodological: moving a calibration from a master to a secondary instrument, or from one site to another, remains difficult [10,11]; robustness against sample physical variability is not guaranteed; and validation of a multivariate method does not map neatly onto the classical parameters of ICH Q2 [12]. The introduction of ICH Q2 (R2) and Q14, which explicitly cover multivariate and spectroscopic procedures and lifecycle management, makes these questions timely [12,13]. The European Medicines Agency has also issued dedicated guidance on the submission of NIR methods [14].

1.1 Research gap

Existing reviews describe applications of NIR and Raman well, but treat calibration transfer, robustness and validation as secondary topics. A consolidated view of these three issues across different dosage forms, alongside a direct comparison with conventional destructive testing, is lacking.

1.2 Objectives and novelty

i. compares conventional destructive testing with non-destructive NIR and Raman approaches

ii. summarises principles, instrumentation and chemometric workflow

iii. maps applications to dosage forms and critically discusses calibration transfer, method robustness and validation, including the current regulatory framework.

1.3 Literature search strategy

Literature was identified through PubMed, Scopus, Web of Science and Google Scholar using combinations of the terms "near-infrared spectroscopy", "Raman spectroscopy", "process analytical technology", "calibration transfer", "model robustness", "method validation", "counterfeit", "content uniformity" and "real-time release". Peer-reviewed articles, books, pharmacopoeial chapters and regulatory guidelines were included. Where the same finding appears in multiple sources, the primary research article was preferred.

2. Principles and instrumentation

2.1 Near-infrared spectroscopy

NIR covers approximately 780-2500 nm (12,800-4,000 cm⁻¹). The bands observed are weak overtones and combination bands of fundamental mid-IR vibrations, chiefly of hydrogen-containing groups [15,16]. Because absorptivities are low, intact tablets and bulk powders can be measured directly, usually by diffuse reflectance or transmission, with fibre-optic probes enabling in-line use [17,18]. The same weakness makes bands broad and overlapping, so quantitative work depends on chemometrics. NIR is particularly sensitive to water and to physical properties such as particle size, density and compaction [5,17].

2.2 Raman spectroscopy

Raman spectroscopy detects the small fraction of scattered photons shifted in energy by molecular vibrations [19]. Bands are narrow and chemically specific, water is a weak scatterer, and glass and many polymers are largely transparent, which allows measurement through vials and blister packs [8,20]. Its principal limitation is fluorescence, which can mask the signal, and the very small sampling volume of conventional point probes, which raises sampling-representativeness questions for heterogeneous solids. Raman is especially suited to polymorph and API-specific analysis [8,21].

2.3 Chemical imaging and spatially offset Raman spectroscopy

Hyperspectral NIR and Raman imaging combine spatial and spectral information, allowing blend homogeneity, API domain size and coating distribution to be visualised [22,23,24]. Spatially offset Raman spectroscopy (SORS) collects light from a region displaced from the excitation point, which suppresses surface (packaging) signal and permits identification of contents through opaque containers [25]. SORS has been used to authenticate products through packaging and to identify counterfeit anti-malarial tablets through blister packs [26,27].

2.4 Pharmacopoeial status

Both techniques are recognised in compendia: USP <1119> and <1120>, and the European Pharmacopoeia general chapters 2.2.40 (NIR) and 2.2.48 (Raman) describe instrument qualification, performance checks and general principles for qualitative and quantitative use [28-31].
figure

Figure 1: Schematic of the Working Principle and Measurement Modes of NIR (Diffuse Reflectance/Transmission) and Raman (Backscatter, SORS) Spectroscopy, Showing Off-Line, At-Line, On-Line and In-Line Implementation.

Table 1: Comparison of NIR and Raman Spectroscopy for Pharmaceutical Quality Testing

Feature NIR Raman
Physical origin Absorption (overtone/combination bands) Inelastic scattering
Spectral band character Broad, overlapping Narrow, specific
Water interference Strong Weak
Fluorescence interference None Can be severe
Sampling through glass/blister Limited Possible (SORS for opaque packs)
Sensitivity to physical properties (particle size, density) High Moderate
Sampled volume Larger, more representative Small for point probe (mitigated by mapping or wide-area probes)
Typical strengths Moisture, blend and content uniformity, identification, coating Polymorph, API-specific quantification, aqueous systems, through-pack analysis
Need for chemometrics Essential Often used, simpler for well-resolved bands

3. Conventional destructive versus non-destructive analysis

Conventional methods such as HPLC and dissolution are based on well-understood primary measurement principles and are generally highly specific and sensitive. Their drawbacks are sample destruction, sample preparation, solvent use, analyst-dependent variability and delay between sampling and result [1,5]. NIR and Raman methods trade some of that primary-method authority for speed, non-destruction and the possibility of testing a much larger number of units, or even every unit, which improves statistical confidence in batch quality [3,5,7]. They are, however, dependent on a reference method and on a maintained calibration, which creates a different kind of burden that is discussed in Section 6.

Table 2: Conventional Destructive Testing Versus NIR/Raman Non-Destructive Approaches

Aspect Conventional destructive methods (HPLC, dissolution, KF, titration) NIR / Raman
Sample preparation Extraction, dilution, filtration None or minimal
Sample fate Destroyed Retained, can be re-tested
Analysis time Minutes to hours per sample Seconds to minutes
Solvent and waste High Negligible
Number of units testable Few per batch Large numbers, potentially 100% inspection
Suitability for real-time/in-line use Not possible Established
Basis of result Primary, direct Secondary, relies on a reference method and a model
Specificity High (separation based) Depends on chemometric model
Main limitation Cost, delay, destructive Calibration development, transfer and maintenance
Regulatory framework Mature Maturing (ICH Q2(R2)/Q14, EMA NIR guideline, USP, Ph. Eur.)

4. Applications across dosage forms

4.1 Solid oral dosage forms

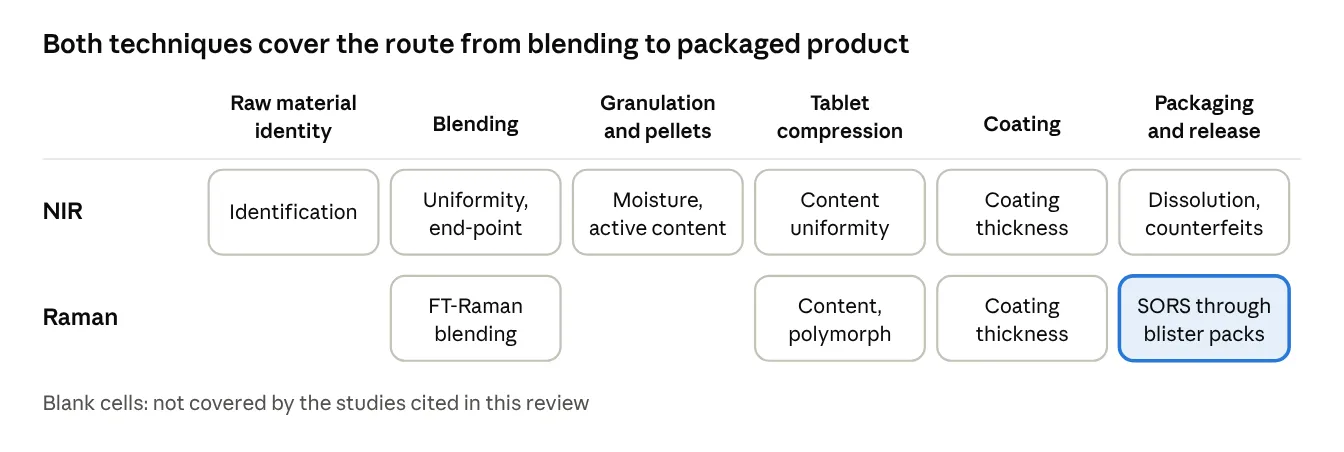
In powder blending, in-line NIR and Raman have been used to follow blend homogeneity and determine the end-point [32,33]. NIR imaging has been used to assess blend uniformity from the resulting tablets [22]. For finished tablets, NIR and low-resolution Raman methods have been developed for content uniformity, with NIR calibration transfer across five instruments demonstrated using robust algorithms [34,35]. Raman has been applied to the measurement of film-coating thickness [36] and to quantification of polymorphic contaminants, in a comparison with NIR [37]. Dissolution behaviour has been predicted from NIR spectra of intact tablets [38,39], and NIR prediction of dissolution in continuous direct compression has been presented as an enabler of real-time release testing [39,40,41].

4.2 Pellets, granules and liquids

NIR methods for moisture and active content have been developed and validated for non-coated pellets [42,43], and for low-dose paracetamol syrup [44]. These examples are important because validation was carried out using the total-error approach rather than only classical parameters.

4.3 Continuous manufacturing and lyophilisation

PAT tools, including NIR and Raman, are integrated into continuous manufacturing lines for solid dosage forms [41,45]. Raman has been applied to in-line monitoring of the freeze-drying process, where it can follow solid-state transformations during the cycle [46]. Extensive overviews of PAT trends are available [45].

4.4 Counterfeit and substandard medicine screening

Both techniques are widely used for screening suspect medicines at the point of need. NIR with a large spectral library has been used to detect counterfeit tablets [48,49], and the nature of the counterfeit market has been reviewed [47]. SORS enables through-pack screening without opening the package [26,27].
figure

Figure 2: Application Map of NIR and Raman Across Dosage Forms (Tablets, Capsules, Powders/Blends, Pellets, Liquids, Lyophilised Products, Packaged Products) and Manufacturing Stages (Raw Material Identification, Blending, Granulation, Compression, Coating, Packaging, Release).

Table 3: Selected Applications of NIR and Raman by Dosage Form

Dosage form / material Quality attribute Technique Representative reference
Powder blends Blend uniformity, end-point In-line NIR, FT-Raman [32,33]
Tablets Content uniformity NIR, low-resolution Raman [34,35]
Tablets Blend homogeneity (imaging) NIR chemical imaging [22]
Coated tablets Coating thickness Raman [36]
Tablets Polymorphic impurity Raman, NIR [37]
Tablets Dissolution prediction, RTRT NIR [38-40]
Pellets Moisture, active content NIR [42,43]
Syrup Low-dose API content NIR [44]
Freeze-dried product Process state Raman [46]
Packaged products Authentication through packaging SORS [26,27]
Tablets (market samples) Counterfeit detection NIR [48,49]

5. Chemometric workflow

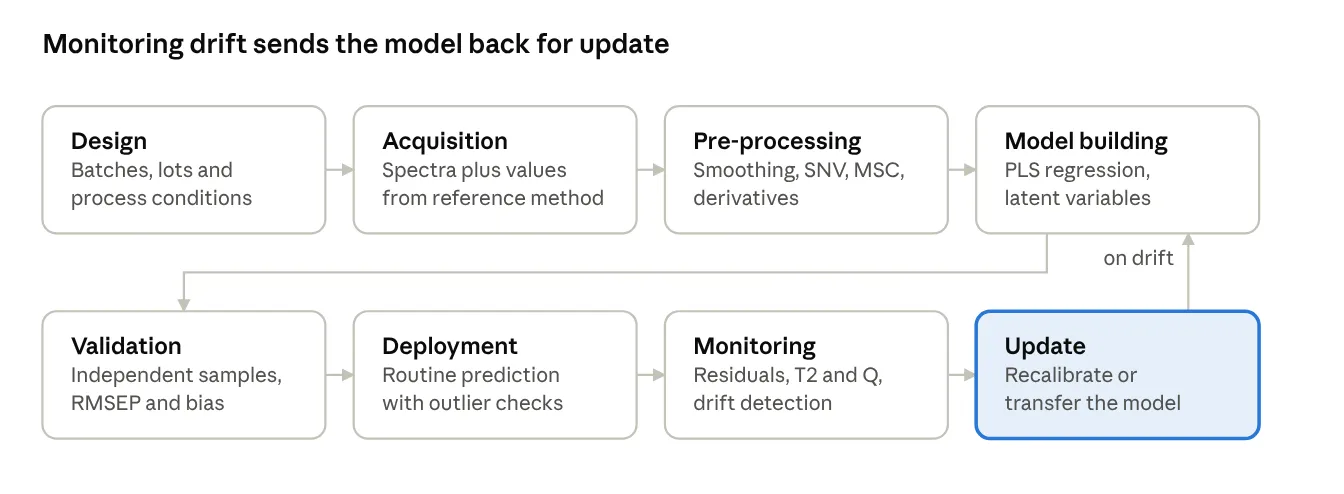
A typical quantitative workflow comprises spectral acquisition, pre-processing, variable selection, model building, validation and deployment (Figure 3). Pre-processing corrects physical effects: Savitzky-Golay smoothing and derivatives [51], standard normal variate [52] and multiplicative scatter correction [53] are most widely applied, and their effects on NIR spectra have been systematically reviewed [54]. Partial least squares (PLS) regression is the standard method for quantitative models [50], and general chemometric principles are described in standard texts [55]. Choice of pre-processing and number of latent variables strongly affects robustness, so these choices should be justified during method development rather than optimised only for calibration fit.
figure

Figure 3: Chemometric Workflow for NIR/Raman Method Development: Calibration Design, Spectral Acquisition, Pre-Processing, Model Building, Validation, Deployment and Lifecycle Monitoring.

6. Calibration transfer

6.1 The problem

Spectra of the same sample differ between instruments because of differences in wavelength axis, resolution, detector response, optical path and source, and over time in a single instrument because of ageing and maintenance. A model built on one instrument (master) therefore often performs poorly on another (secondary) [10,58,59]. This is a major cost driver because rebuilding a calibration set is laborious. The problem is even greater for Raman because of differences in laser wavelength, intensity axis and probe geometry between instruments.

6.2 Algorithms

Transfer methods fall into three groups: standardisation of the predicted response (slope and bias correction), standardisation of the spectra (direct standardisation, piecewise direct standardisation) [56-59], and model-based approaches that make the calibration inherently insensitive to instrument differences, for example by including data from several instruments or by robust model design [10,11]. Practical comparisons indicate that no single algorithm is universally best and that the quality of the transfer samples matters as much as the algorithm [11,59].

Table 4: Calibration Transfer Approaches

Approach Principle Main advantage Main limitation
Slope/bias correction Adjust predicted values using a few transfer samples Simple Corrects only simple offsets
Direct standardisation (DS) Transform secondary spectra to master using a transformation matrix [56] Corrects global spectral differences Needs transfer samples measured on both instruments
Piecewise direct standardisation (PDS) Local-window transformation [56,57] Handles local wavelength shifts Window selection affects results
Spectral pre-processing/derivative-based correction Remove baseline and scatter differences [54] No transfer samples needed May not resolve axis or resolution differences
Multi-instrument (global) calibration Include several instruments in calibration set [10,59] Robust to instrument variability Higher initial effort
Robust multivariate transfer algorithms Use of validated robust transfer algorithms Demonstrated across five instruments [35] Requires careful selection of samples and parameters

6.3 Gaps

(i) Most published transfers are for NIR; reports for Raman are fewer. (ii) Transfer sets are often laboratory-scale, rarely multi-site, and rarely include long-term monitoring. (iii) Acceptance criteria for a successful transfer are not harmonised. (iv) Few studies test transfer across different dosage forms or manufacturing scales. These points are consistent with the observations in the earlier reviews [10,11].

7. Method robustness

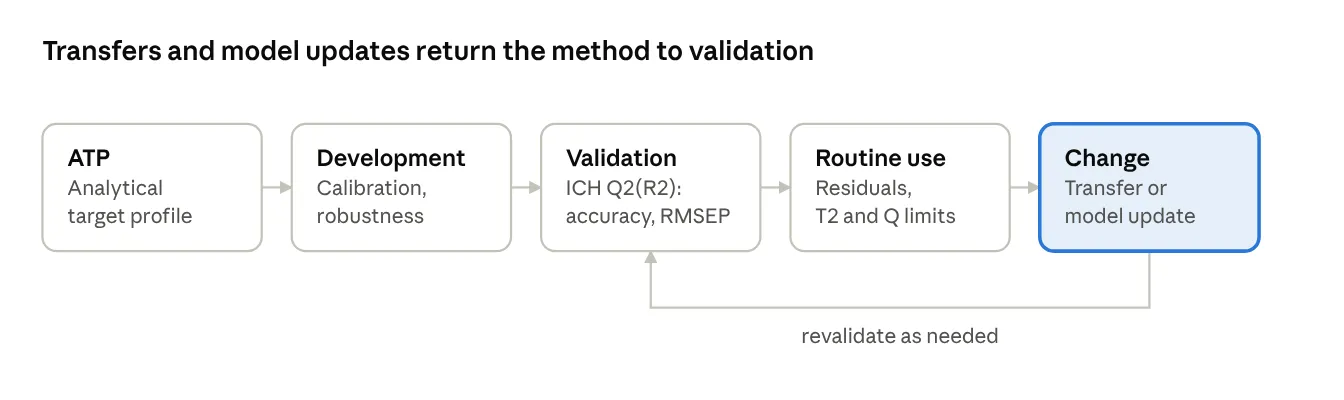
Robustness of a spectroscopic method should be assessed against variations in sample presentation (compaction, particle size, moisture, temperature), instrument state (warm-up, source ageing, probe fouling), and operator or environmental factors [5,17,60]. Because calibration sets are constructed to include the expected variability, robustness is partly built in during design: a design that spans realistic ranges of temperature, humidity, tablet hardness and different raw-material lots gives better model stability than one based on a single batch. Routine performance monitoring, such as tracking prediction residuals, Hotelling's T² and Q statistics, enables detection of model drift, which triggers maintenance or update [12,13]. Fluorescence in Raman and moisture or temperature effects on NIR deserve particular attention, since they act differently in each technique.

8. Validation and regulatory aspects

ICH Q2 (R2) adds explicit recommendations for multivariate and spectroscopic procedures and links validation to the analytical procedure lifecycle described in ICH Q14 [12,13]. EMA guidance describes the data to be provided for NIR procedures, including model development and maintenance [14]. USP and Ph. Eur. chapters describe qualification and performance verification of the instrument [28-31]. In practice, parameters such as specificity, accuracy, precision, range, linearity of predicted versus reference values and robustness remain relevant, but they are interpreted using the prediction performance of the model, for example RMSEP and bias against the reference method, rather than classical calibration curves. Approaches based on accuracy profiles and total error have been applied to NIR methods for pellets and syrups [42-44].

Table 5: Validation Characteristics for NIR/Raman Methods (Interpretation Under ICH Q2 (R2)/Q14)

Characteristic Interpretation for a spectroscopic multivariate method
Specificity Demonstrated by model loadings/regression vector, spectra of API, excipients, placebo, and challenge samples
Accuracy Agreement of predicted values with the reference method on independent validation samples (bias, RMSEP)
Precision Repeatability and intermediate precision of predictions across replicate scans, days, analysts and instruments
Range Concentration range of the calibration set, covering the specification limits
Linearity Plot of predicted versus reference values over the range
Robustness Deliberate variation of sample presentation and instrument/environment factors, including transfer to a second instrument
Model maintenance Ongoing monitoring (residuals, T², Q), revalidation after changes in formulation, raw material, process or instrument (lifecycle approach)
Reference method Fully validated primary method used for calibration and verification

figure

Figure 4: Lifecycle of an NIR/Raman Analytical Procedure Under ICH Q14 and Q2 (R2): Analytical Target Profile, Development, Validation, Routine Use with Monitoring, Calibration Transfer and Model Update.

9. Challenges and future perspectives

Several issues should be addressed to enable wider acceptance. First, harmonised acceptance criteria for calibration transfer, particularly for Raman, would remove ambiguity during regulatory review. Second, shared multi-site and multi-instrument datasets would allow benchmarking of transfer algorithms. Third, model-maintenance strategies, including adaptive updating with documented change control, should be integrated into the pharmaceutical quality system. Fourth, handheld and miniaturised devices, together with SORS, are expanding point-of-need screening of substandard and falsified medicines, which require library management and transfer across devices [26,27,48,49]. Fifth, integration with continuous manufacturing and real-time release will rely on robust models [2,3,40,41,45]. Finally, machine learning and deep learning may help address non-linearity and transfer, though their validation and interpretability under the current regulatory framework must be demonstrated.

CONCLUSION

NIR and Raman spectroscopy are mature, complementary, non-destructive techniques that support the transition from end-product testing to continuous, real-time quality assurance. Their adoption is no longer limited by hardware but by the practical aspects of calibration transfer, robustness and validation. The current regulatory framework (ICH Q2 (R2), ICH Q14, EMA guidance and pharmacopoeial chapters) now provides a path for lifecycle-based management of such methods. Harmonised transfer criteria, multi-site data and good model-maintenance practices will be the key to wider routine use across dosage forms.

Conflict of interest

The author declares no conflict of interest.

REFERENCES

  1. Bakeev KA, editor. Process Analytical Technology: Spectroscopic Tools and Implementation Strategies for the Chemical and Pharmaceutical Industries. 2nd ed. Chichester: Wiley; 2010.
  2. Rantanen J, Khinast J. The future of pharmaceutical manufacturing sciences. J Pharm Sci. 2015;104 (11):3612-3638.
  3. Lee SL, O'Connor TF, Yang X, Cruz CN, Chatterjee S, Madurawe RD, et al. Modernizing pharmaceutical manufacturing: from batch to continuous production. J Pharm Innov. 2015;10:191-199.
  4. U.S. Food and Drug Administration. Guidance for Industry: PAT - A Framework for Innovative Pharmaceutical Development, Manufacturing, and Quality Assurance. Rockville (MD): FDA; 2004.
  5. Reich G. Near-infrared spectroscopy and imaging: basic principles and pharmaceutical applications. Adv Drug Deliv Rev. 2005;57 (8):1109-1143.
  6. Roggo Y, Chalus P, Maurer L, Lema-Martinez C, Edmond A, Jent N. A review of near infrared spectroscopy and chemometrics in pharmaceutical technologies. J Pharm Biomed Anal. 2007;44 (3):683-700.
  7. De Beer T, Burggraeve A, Fonteyne M, Saerens L, Remon JP, Vervaet C. Near infrared and Raman spectroscopy for the in-process monitoring of pharmaceutical production processes. Int J Pharm. 2011;417 (1-2):32-47.
  8. Paudel A, Raijada D, Rantanen J. Raman spectroscopy in pharmaceutical product design. Adv Drug Deliv Rev. 2015;89:3-20.
  9. Esmonde-White KA, Cuellar M, Uerpmann C, Lenain B, Lewis IR. Raman spectroscopy as a process analytical technology for pharmaceutical manufacturing and bioprocessing. Anal Bioanal Chem. 2017;409:637-649.
  10. Feudale RN, Woody NA, Tan H, Myles AJ, Brown SD, Ferré J. Transfer of multivariate calibration models: a review. Chemom Intell Lab Syst. 2002;64 (2):181-192.
  11. Workman JJ Jr. A review of calibration transfer practices and instrument differences in spectroscopy. Appl Spectrosc. 2018;72 (3):340-365.
  12. International Council for Harmonisation. ICH Q2 (R2): Validation of Analytical Procedures. Geneva: ICH; 2023.
  13. International Council for Harmonisation. ICH Q14: Analytical Procedure Development. Geneva: ICH; 2023.
  14. European Medicines Agency. Guideline on the use of near infrared spectroscopy (NIRS) by the pharmaceutical industry and the data requirements for new submissions and variations. EMA/CHMP/CVMP/QWP/17760/2009 Rev. 2. London: EMA; 2014.
  15. Siesler HW, Ozaki Y, Kawata S, Heise HM, editors. Near-Infrared Spectroscopy: Principles, Instruments, Applications. Weinheim: Wiley-VCH; 2002.
  16. Workman J Jr, Weyer L. Practical Guide and Spectral Atlas for Interpretive Near-Infrared Spectroscopy. 2nd ed. Boca Raton: CRC Press; 2012.
  17. Blanco M, Villarroya I. NIR spectroscopy: a rapid-response analytical tool. TrAC Trends Anal Chem. 2002;21 (4):240-250.
  18. Blanco M, Coello J, Iturriaga H, Maspoch S, de la Pezuela C. Near-infrared spectroscopy in the pharmaceutical industry. Analyst. 1998;123:135R-150R.
  19. Smith E, Dent G. Modern Raman Spectroscopy: A Practical Approach. Chichester: Wiley; 2005.
  20. Vankeirsbilck T, Vercauteren A, Baeyens W, Van der Weken G, Verpoort F, Vergote G, et al. Applications of Raman spectroscopy in pharmaceutical analysis. TrAC Trends Anal Chem. 2002;21 (12):869-877.
  21. Strachan CJ, Rades T, Gordon KC, Rantanen J. Raman spectroscopy for quantitative analysis of pharmaceutical solids. J Pharm Pharmacol. 2007;59 (2):179-192.
  22. Lyon RC, Lester DS, Lewis EN, Lee E, Yu LX, Jefferson EH, et al. Near-infrared spectral imaging for quality assurance of pharmaceutical products: analysis of tablets to assess powder blend homogeneity. AAPS PharmSciTech. 2002;3 (3):E17.
  23. Gordon KC, McGoverin CM. Raman mapping of pharmaceuticals. Int J Pharm. 2011;417 (1-2):151-162.
  24. Roggo Y, Edmond A, Chalus P, Ulmschneider M. Infrared hyperspectral imaging for qualitative analysis of pharmaceutical solid forms. Anal Chim Acta. 2005;535 (1-2):79-87.
  25. Matousek P, Clark IP, Draper ERC, Morris MD, Goodship AE, Everall N, et al. Subsurface probing in diffusely scattering media using spatially offset Raman spectroscopy. Appl Spectrosc. 2005;59 (4):393-400.
  26. Eliasson C, Matousek P. Noninvasive authentication of pharmaceutical products through packaging using spatially offset Raman spectroscopy. Anal Chem. 2007;79 (4):1696-1701.
  27. Ricci C, Eliasson C, Macleod NA, Newton PN, Matousek P, Kazarian SG. Characterization of genuine and fake artesunate anti-malarial tablets using Fourier transform infrared imaging and spatially offset Raman spectroscopy through blister packs. Anal Bioanal Chem. 2007;389:1525-1532.
  28. United States Pharmacopeia. General Chapter <1119> Near-Infrared Spectroscopy. Rockville (MD): USP.
  29. United States Pharmacopeia. General Chapter <1120> Raman Spectroscopy. Rockville (MD): USP.
  30. European Pharmacopoeia. General chapter 2.2.40: Near-infrared spectroscopy. Strasbourg: EDQM.
  31. European Pharmacopoeia. General chapter 2.2.48: Raman spectrometry. Strasbourg: EDQM.
  32. Vergote GJ, De Beer TRM, Vervaet C, Remon JP, Baeyens WRG, Diericx N, et al. In-line monitoring of a pharmaceutical blending process using FT-Raman spectroscopy. Eur J Pharm Sci. 2004;21 (4):479-485.
  33. Moes JJ, Ruijken MM, Gout E, Frijlink HW, Ugwoke MI. Application of process analytical technology in tablet process development using NIR spectroscopy: blend uniformity, content uniformity and coating thickness measurements. Int J Pharm. 2008;357 (1-2):108-118.
  34. Wikström H, Romero-Torres S, Wongweragiat S, Williams JAS, Grant ER, Taylor LS. On-line content uniformity determination of tablets using low-resolution Raman spectroscopy. Appl Spectrosc. 2006;60 (8):934-943.
  35. Sulub Y, LoBrutto R, Vivilecchia R, Wabuyele BW. Content uniformity determination of pharmaceutical tablets using five near-infrared reflectance spectrometers: a process analytical technology (PAT) approach using robust multivariate calibration transfer algorithms. Anal Chim Acta. 2008;611 (2):143-150.
  36. Kauffman JF, Dellibovi M, Cunningham CR. Raman spectroscopy of coated pharmaceutical tablets and physical models for multivariate calibration to tablet coating thickness. J Pharm Biomed Anal. 2007;43 (1):39-48.
  37. Hennigan MC, Ryder AG. Quantitative polymorph contaminant analysis in tablets using Raman and near infra-red spectroscopies. J Pharm Biomed Anal. 2013;72:163-171.
  38. Freitas MP, Sabadin A, Silva LM, Giannotti FM, do Couto DA, Tonhi E, et al. Prediction of drug dissolution profiles from tablets using NIR diffuse reflectance spectroscopy: a rapid and nondestructive method. J Pharm Biomed Anal. 2005;39 (1-2):17-21.
  39. Pawar P, Wang Y, Keyvan G, Callegari G, Cuitino A, Muzzio F. Enabling real time release testing by NIR prediction of dissolution of tablets made by continuous direct compression (CDC). Int J Pharm. 2016;512 (1):96-107.
  40. Pestieau A, Krier F, Thoorens G, Dupont A, Chavez PF, Ziémons E, et al. Towards a real time release approach for manufacturing tablets using NIR spectroscopy. J Pharm Biomed Anal. 2014;98:60-67.
  41. Fonteyne M, Vercruysse J, De Leersnyder F, Van Snick B, Vervaet C, Remon JP, De Beer T. Process analytical technology for continuous manufacturing of solid-dosage forms. TrAC Trends Anal Chem. 2015;67:159-166.
  42. Mantanus J, Ziémons E, Lebrun P, Rozet E, Klinkenberg R, Streel B, et al. Moisture content determination of pharmaceutical pellets by near infrared spectroscopy: method development and validation. Anal Chim Acta. 2009;642 (1-2):186-192.
  43. Mantanus J, Ziémons E, Lebrun P, Rozet E, Klinkenberg R, Streel B, et al. Active content determination of non-coated pharmaceutical pellets by near infrared spectroscopy: method development, validation and reliability evaluation. Talanta. 2010;80 (5):1750-1757.
  44. Ziémons E, Mantanus J, Lebrun P, Rozet E, Evrard B, Hubert P. Acetaminophen determination in low-dose pharmaceutical syrup by NIR spectroscopy. J Pharm Biomed Anal. 2010;53 (3):510-516.
  45. Simon LL, Pataki H, Marosi G, Meemken F, Hungerbühler K, Baiker A, et al. Assessment of recent process analytical technology (PAT) trends: a multiauthor review. Org Process Res Dev. 2015;19 (1):3-62.
  46. De Beer TRM, Allesø M, Goethals F, Coppens A, Vander Heyden Y, Lopez De Diego H, et al. Implementation of a process analytical technology system in a freeze-drying process using Raman spectroscopy for in-line process monitoring. Anal Chem. 2007;79 (21):7992-8003.
  47. Dégardin K, Roggo Y, Margot P. Understanding and fighting the medicine counterfeit market. J Pharm Biomed Anal. 2014;87:167-175.
  48. Dégardin K, Guillemain A, Guerreiro NV, Roggo Y. Near infrared spectroscopy for counterfeit detection using a large database of pharmaceutical tablets. J Pharm Biomed Anal. 2016;128:89-97.
  49. Rodionova OY, Houmøller LP, Pomerantsev AL, Geladi P, Burger J, Dorofeyev VL, Arzamastsev AP. NIR spectrometry for counterfeit drug detection: a feasibility study. Anal Chim Acta. 2005;549 (1-2):151-158.
  50. Wold S, Sjöström M, Eriksson L. PLS-regression: a basic tool of chemometrics. Chemom Intell Lab Syst. 2001;58 (2):109-130.
  51. Savitzky A, Golay MJE. Smoothing and differentiation of data by simplified least squares procedures. Anal Chem. 1964;36 (8):1627-1639.
  52. Barnes RJ, Dhanoa MS, Lister SJ. Standard normal variate transformation and de-trending of near-infrared diffuse reflectance spectra. Appl Spectrosc. 1989;43 (5):772-777.
  53. Geladi P, MacDougall D, Martens H. Linearization and scatter-correction for near-infrared reflectance spectra of meat. Appl Spectrosc. 1985;39 (3):491-500.
  54. Rinnan Å, van den Berg F, Engelsen SB. Review of the most common pre-processing techniques for near-infrared spectra. TrAC Trends Anal Chem. 2009;28 (10):1201-1222.
  55. Brereton RG. Chemometrics: Data Analysis for the Laboratory and Chemical Plant. Chichester: Wiley; 2003.
  56. Wang Y, Veltkamp DJ, Kowalski BR. Multivariate instrument standardization. Anal Chem. 1991;63 (23):2750-2756.
  57. Wang Y, Lysaght MJ, Kowalski BR. Improvement of multivariate calibration through instrument standardization. Anal Chem. 1992;64 (5):562-564.
  58. Bouveresse E, Massart DL. Standardisation of near-infrared spectrometric instruments: a review. Vib Spectrosc. 1996;11 (1):3-15.
  59. Fearn T. Standardisation and calibration transfer for near infrared instruments: a review. J Near Infrared Spectrosc. 2001;9 (4):229-244.
  60. Bec KB, Grabska J, Huck CW. Near-infrared spectroscopy in bio-applications. Molecules. 2020;25 (12):2948.

Reference

  1. Bakeev KA, editor. Process Analytical Technology: Spectroscopic Tools and Implementation Strategies for the Chemical and Pharmaceutical Industries. 2nd ed. Chichester: Wiley; 2010.
  2. Rantanen J, Khinast J. The future of pharmaceutical manufacturing sciences. J Pharm Sci. 2015;104 (11):3612-3638.
  3. Lee SL, O'Connor TF, Yang X, Cruz CN, Chatterjee S, Madurawe RD, et al. Modernizing pharmaceutical manufacturing: from batch to continuous production. J Pharm Innov. 2015;10:191-199.
  4. U.S. Food and Drug Administration. Guidance for Industry: PAT - A Framework for Innovative Pharmaceutical Development, Manufacturing, and Quality Assurance. Rockville (MD): FDA; 2004.
  5. Reich G. Near-infrared spectroscopy and imaging: basic principles and pharmaceutical applications. Adv Drug Deliv Rev. 2005;57 (8):1109-1143.
  6. Roggo Y, Chalus P, Maurer L, Lema-Martinez C, Edmond A, Jent N. A review of near infrared spectroscopy and chemometrics in pharmaceutical technologies. J Pharm Biomed Anal. 2007;44 (3):683-700.
  7. De Beer T, Burggraeve A, Fonteyne M, Saerens L, Remon JP, Vervaet C. Near infrared and Raman spectroscopy for the in-process monitoring of pharmaceutical production processes. Int J Pharm. 2011;417 (1-2):32-47.
  8. Paudel A, Raijada D, Rantanen J. Raman spectroscopy in pharmaceutical product design. Adv Drug Deliv Rev. 2015;89:3-20.
  9. Esmonde-White KA, Cuellar M, Uerpmann C, Lenain B, Lewis IR. Raman spectroscopy as a process analytical technology for pharmaceutical manufacturing and bioprocessing. Anal Bioanal Chem. 2017;409:637-649.
  10. Feudale RN, Woody NA, Tan H, Myles AJ, Brown SD, Ferré J. Transfer of multivariate calibration models: a review. Chemom Intell Lab Syst. 2002;64 (2):181-192.
  11. Workman JJ Jr. A review of calibration transfer practices and instrument differences in spectroscopy. Appl Spectrosc. 2018;72 (3):340-365.
  12. International Council for Harmonisation. ICH Q2 (R2): Validation of Analytical Procedures. Geneva: ICH; 2023.
  13. International Council for Harmonisation. ICH Q14: Analytical Procedure Development. Geneva: ICH; 2023.
  14. European Medicines Agency. Guideline on the use of near infrared spectroscopy (NIRS) by the pharmaceutical industry and the data requirements for new submissions and variations. EMA/CHMP/CVMP/QWP/17760/2009 Rev. 2. London: EMA; 2014.
  15. Siesler HW, Ozaki Y, Kawata S, Heise HM, editors. Near-Infrared Spectroscopy: Principles, Instruments, Applications. Weinheim: Wiley-VCH; 2002.
  16. Workman J Jr, Weyer L. Practical Guide and Spectral Atlas for Interpretive Near-Infrared Spectroscopy. 2nd ed. Boca Raton: CRC Press; 2012.
  17. Blanco M, Villarroya I. NIR spectroscopy: a rapid-response analytical tool. TrAC Trends Anal Chem. 2002;21 (4):240-250.
  18. Blanco M, Coello J, Iturriaga H, Maspoch S, de la Pezuela C. Near-infrared spectroscopy in the pharmaceutical industry. Analyst. 1998;123:135R-150R.
  19. Smith E, Dent G. Modern Raman Spectroscopy: A Practical Approach. Chichester: Wiley; 2005.
  20. Vankeirsbilck T, Vercauteren A, Baeyens W, Van der Weken G, Verpoort F, Vergote G, et al. Applications of Raman spectroscopy in pharmaceutical analysis. TrAC Trends Anal Chem. 2002;21 (12):869-877.
  21. Strachan CJ, Rades T, Gordon KC, Rantanen J. Raman spectroscopy for quantitative analysis of pharmaceutical solids. J Pharm Pharmacol. 2007;59 (2):179-192.
  22. Lyon RC, Lester DS, Lewis EN, Lee E, Yu LX, Jefferson EH, et al. Near-infrared spectral imaging for quality assurance of pharmaceutical products: analysis of tablets to assess powder blend homogeneity. AAPS PharmSciTech. 2002;3 (3):E17.
  23. Gordon KC, McGoverin CM. Raman mapping of pharmaceuticals. Int J Pharm. 2011;417 (1-2):151-162.
  24. Roggo Y, Edmond A, Chalus P, Ulmschneider M. Infrared hyperspectral imaging for qualitative analysis of pharmaceutical solid forms. Anal Chim Acta. 2005;535 (1-2):79-87.
  25. Matousek P, Clark IP, Draper ERC, Morris MD, Goodship AE, Everall N, et al. Subsurface probing in diffusely scattering media using spatially offset Raman spectroscopy. Appl Spectrosc. 2005;59 (4):393-400.
  26. Eliasson C, Matousek P. Noninvasive authentication of pharmaceutical products through packaging using spatially offset Raman spectroscopy. Anal Chem. 2007;79 (4):1696-1701.
  27. Ricci C, Eliasson C, Macleod NA, Newton PN, Matousek P, Kazarian SG. Characterization of genuine and fake artesunate anti-malarial tablets using Fourier transform infrared imaging and spatially offset Raman spectroscopy through blister packs. Anal Bioanal Chem. 2007;389:1525-1532.
  28. United States Pharmacopeia. General Chapter <1119> Near-Infrared Spectroscopy. Rockville (MD): USP.
  29. United States Pharmacopeia. General Chapter <1120> Raman Spectroscopy. Rockville (MD): USP.
  30. European Pharmacopoeia. General chapter 2.2.40: Near-infrared spectroscopy. Strasbourg: EDQM.
  31. European Pharmacopoeia. General chapter 2.2.48: Raman spectrometry. Strasbourg: EDQM.
  32. Vergote GJ, De Beer TRM, Vervaet C, Remon JP, Baeyens WRG, Diericx N, et al. In-line monitoring of a pharmaceutical blending process using FT-Raman spectroscopy. Eur J Pharm Sci. 2004;21 (4):479-485.
  33. Moes JJ, Ruijken MM, Gout E, Frijlink HW, Ugwoke MI. Application of process analytical technology in tablet process development using NIR spectroscopy: blend uniformity, content uniformity and coating thickness measurements. Int J Pharm. 2008;357 (1-2):108-118.
  34. Wikström H, Romero-Torres S, Wongweragiat S, Williams JAS, Grant ER, Taylor LS. On-line content uniformity determination of tablets using low-resolution Raman spectroscopy. Appl Spectrosc. 2006;60 (8):934-943.
  35. Sulub Y, LoBrutto R, Vivilecchia R, Wabuyele BW. Content uniformity determination of pharmaceutical tablets using five near-infrared reflectance spectrometers: a process analytical technology (PAT) approach using robust multivariate calibration transfer algorithms. Anal Chim Acta. 2008;611 (2):143-150.
  36. Kauffman JF, Dellibovi M, Cunningham CR. Raman spectroscopy of coated pharmaceutical tablets and physical models for multivariate calibration to tablet coating thickness. J Pharm Biomed Anal. 2007;43 (1):39-48.
  37. Hennigan MC, Ryder AG. Quantitative polymorph contaminant analysis in tablets using Raman and near infra-red spectroscopies. J Pharm Biomed Anal. 2013;72:163-171.
  38. Freitas MP, Sabadin A, Silva LM, Giannotti FM, do Couto DA, Tonhi E, et al. Prediction of drug dissolution profiles from tablets using NIR diffuse reflectance spectroscopy: a rapid and nondestructive method. J Pharm Biomed Anal. 2005;39 (1-2):17-21.
  39. Pawar P, Wang Y, Keyvan G, Callegari G, Cuitino A, Muzzio F. Enabling real time release testing by NIR prediction of dissolution of tablets made by continuous direct compression (CDC). Int J Pharm. 2016;512 (1):96-107.
  40. Pestieau A, Krier F, Thoorens G, Dupont A, Chavez PF, Ziémons E, et al. Towards a real time release approach for manufacturing tablets using NIR spectroscopy. J Pharm Biomed Anal. 2014;98:60-67.
  41. Fonteyne M, Vercruysse J, De Leersnyder F, Van Snick B, Vervaet C, Remon JP, De Beer T. Process analytical technology for continuous manufacturing of solid-dosage forms. TrAC Trends Anal Chem. 2015;67:159-166.
  42. Mantanus J, Ziémons E, Lebrun P, Rozet E, Klinkenberg R, Streel B, et al. Moisture content determination of pharmaceutical pellets by near infrared spectroscopy: method development and validation. Anal Chim Acta. 2009;642 (1-2):186-192.
  43. Mantanus J, Ziémons E, Lebrun P, Rozet E, Klinkenberg R, Streel B, et al. Active content determination of non-coated pharmaceutical pellets by near infrared spectroscopy: method development, validation and reliability evaluation. Talanta. 2010;80 (5):1750-1757.
  44. Ziémons E, Mantanus J, Lebrun P, Rozet E, Evrard B, Hubert P. Acetaminophen determination in low-dose pharmaceutical syrup by NIR spectroscopy. J Pharm Biomed Anal. 2010;53 (3):510-516.
  45. Simon LL, Pataki H, Marosi G, Meemken F, Hungerbühler K, Baiker A, et al. Assessment of recent process analytical technology (PAT) trends: a multiauthor review. Org Process Res Dev. 2015;19 (1):3-62.
  46. De Beer TRM, Allesø M, Goethals F, Coppens A, Vander Heyden Y, Lopez De Diego H, et al. Implementation of a process analytical technology system in a freeze-drying process using Raman spectroscopy for in-line process monitoring. Anal Chem. 2007;79 (21):7992-8003.
  47. Dégardin K, Roggo Y, Margot P. Understanding and fighting the medicine counterfeit market. J Pharm Biomed Anal. 2014;87:167-175.
  48. Dégardin K, Guillemain A, Guerreiro NV, Roggo Y. Near infrared spectroscopy for counterfeit detection using a large database of pharmaceutical tablets. J Pharm Biomed Anal. 2016;128:89-97.
  49. Rodionova OY, Houmøller LP, Pomerantsev AL, Geladi P, Burger J, Dorofeyev VL, Arzamastsev AP. NIR spectrometry for counterfeit drug detection: a feasibility study. Anal Chim Acta. 2005;549 (1-2):151-158.
  50. Wold S, Sjöström M, Eriksson L. PLS-regression: a basic tool of chemometrics. Chemom Intell Lab Syst. 2001;58 (2):109-130.
  51. Savitzky A, Golay MJE. Smoothing and differentiation of data by simplified least squares procedures. Anal Chem. 1964;36 (8):1627-1639.
  52. Barnes RJ, Dhanoa MS, Lister SJ. Standard normal variate transformation and de-trending of near-infrared diffuse reflectance spectra. Appl Spectrosc. 1989;43 (5):772-777.
  53. Geladi P, MacDougall D, Martens H. Linearization and scatter-correction for near-infrared reflectance spectra of meat. Appl Spectrosc. 1985;39 (3):491-500.
  54. Rinnan Å, van den Berg F, Engelsen SB. Review of the most common pre-processing techniques for near-infrared spectra. TrAC Trends Anal Chem. 2009;28 (10):1201-1222.
  55. Brereton RG. Chemometrics: Data Analysis for the Laboratory and Chemical Plant. Chichester: Wiley; 2003.
  56. Wang Y, Veltkamp DJ, Kowalski BR. Multivariate instrument standardization. Anal Chem. 1991;63 (23):2750-2756.
  57. Wang Y, Lysaght MJ, Kowalski BR. Improvement of multivariate calibration through instrument standardization. Anal Chem. 1992;64 (5):562-564.
  58. Bouveresse E, Massart DL. Standardisation of near-infrared spectrometric instruments: a review. Vib Spectrosc. 1996;11 (1):3-15.
  59. Fearn T. Standardisation and calibration transfer for near infrared instruments: a review. J Near Infrared Spectrosc. 2001;9 (4):229-244.
  60. Bec KB, Grabska J, Huck CW. Near-infrared spectroscopy in bio-applications. Molecules. 2020;25 (12):2948.

Photo
Pranjal Dinesh Ambade
Corresponding author

Datta Meghe College of Pharmacy, Wardha, Maharashtra, India.

Photo
Aditi Sunil Raut
Co-author

Datta Meghe College of Pharmacy, Wardha, Maharashtra, India.

Photo
Mayuri Dhanraj Dhurve
Co-author

Tulsakar College of Pharmacy, Hinganghat, Wardha, Maharashtra, India.

Photo
Pranjali Vinod Farkunde
Co-author

PatalDhamal Wadhwani College of Pharmacy, Yavatmal, Maharashtra, India.

Photo
Radhika Pradip Sahare
Co-author

Tulsakar College of Pharmacy, Hinganghat, Wardha, Maharashtra, India.

Pranjal Dinesh Ambade, Aditi Sunil Raut, Radhika Pradip Sahare, Pranjali Vinod Farkunde, Mayuri Dhanraj Dhurve, Emerging Role of Raman Spectroscopy and Near-Infrared Technology in Non-Destructive Pharmaceutical Quality Testing: A Review of Calibration Transfer, Method Robustness and Validation Across Dosage Forms, Int. J. Med. Pharm. Sci., 2026, 2 (11), 25-35. https://doi.org/10.5281/zenodo.24217786

More related articles
Microfluidic Technologies for Advanced Drug Delive...
Vinoth Jeevanesan, Venkadesh Govindharaja, Vanitha Devi Rajendran...
mRNA Technology in Pharmacy from Vaccine to Therap...
Anjali Mane, P. M. Mohite, Harshali Tambvekar, D. R. Jadge...
3D Printing Technology in Pharmaceutical Formulati...
Soumallya Chakraborty, Soumyadip Saha, Somenath Bhattacharya...
Related Articles
Review on Process Analytical Technology in Pharmaceutical Manufacturing...
Roja K., Sarumathi B., Saminathan C., Akshaya A....
3D Printing Technology in Pharmaceutics an Overview...
G. Sundhar Raja, S. Alexandar, Jesintha Beyatricksb...
Nano Crystal Technology for Novel Drug Delivery Systems: A Review...
Christopher Vimalson D., Vasunthra Devi M., Sivabal R., Sinthan S., Naveenyadav J. K., Kadalselvi S....
Microfluidic Technologies for Advanced Drug Delivery Systems: A Comprehensive Re...
Vinoth Jeevanesan, Venkadesh Govindharaja, Vanitha Devi Rajendran, Sowmiya Balaguru, Silviyamary Fra...
More related articles
Microfluidic Technologies for Advanced Drug Delivery Systems: A Comprehensive Re...
Vinoth Jeevanesan, Venkadesh Govindharaja, Vanitha Devi Rajendran, Sowmiya Balaguru, Silviyamary Fra...
mRNA Technology in Pharmacy from Vaccine to Therapeutic Applications...
Anjali Mane, P. M. Mohite, Harshali Tambvekar, D. R. Jadge...
3D Printing Technology in Pharmaceutical Formulation - An Overview...
Soumallya Chakraborty, Soumyadip Saha, Somenath Bhattacharya...
Microfluidic Technologies for Advanced Drug Delivery Systems: A Comprehensive Re...
Vinoth Jeevanesan, Venkadesh Govindharaja, Vanitha Devi Rajendran, Sowmiya Balaguru, Silviyamary Fra...
mRNA Technology in Pharmacy from Vaccine to Therapeutic Applications...
Anjali Mane, P. M. Mohite, Harshali Tambvekar, D. R. Jadge...
3D Printing Technology in Pharmaceutical Formulation - An Overview...
Soumallya Chakraborty, Soumyadip Saha, Somenath Bhattacharya...